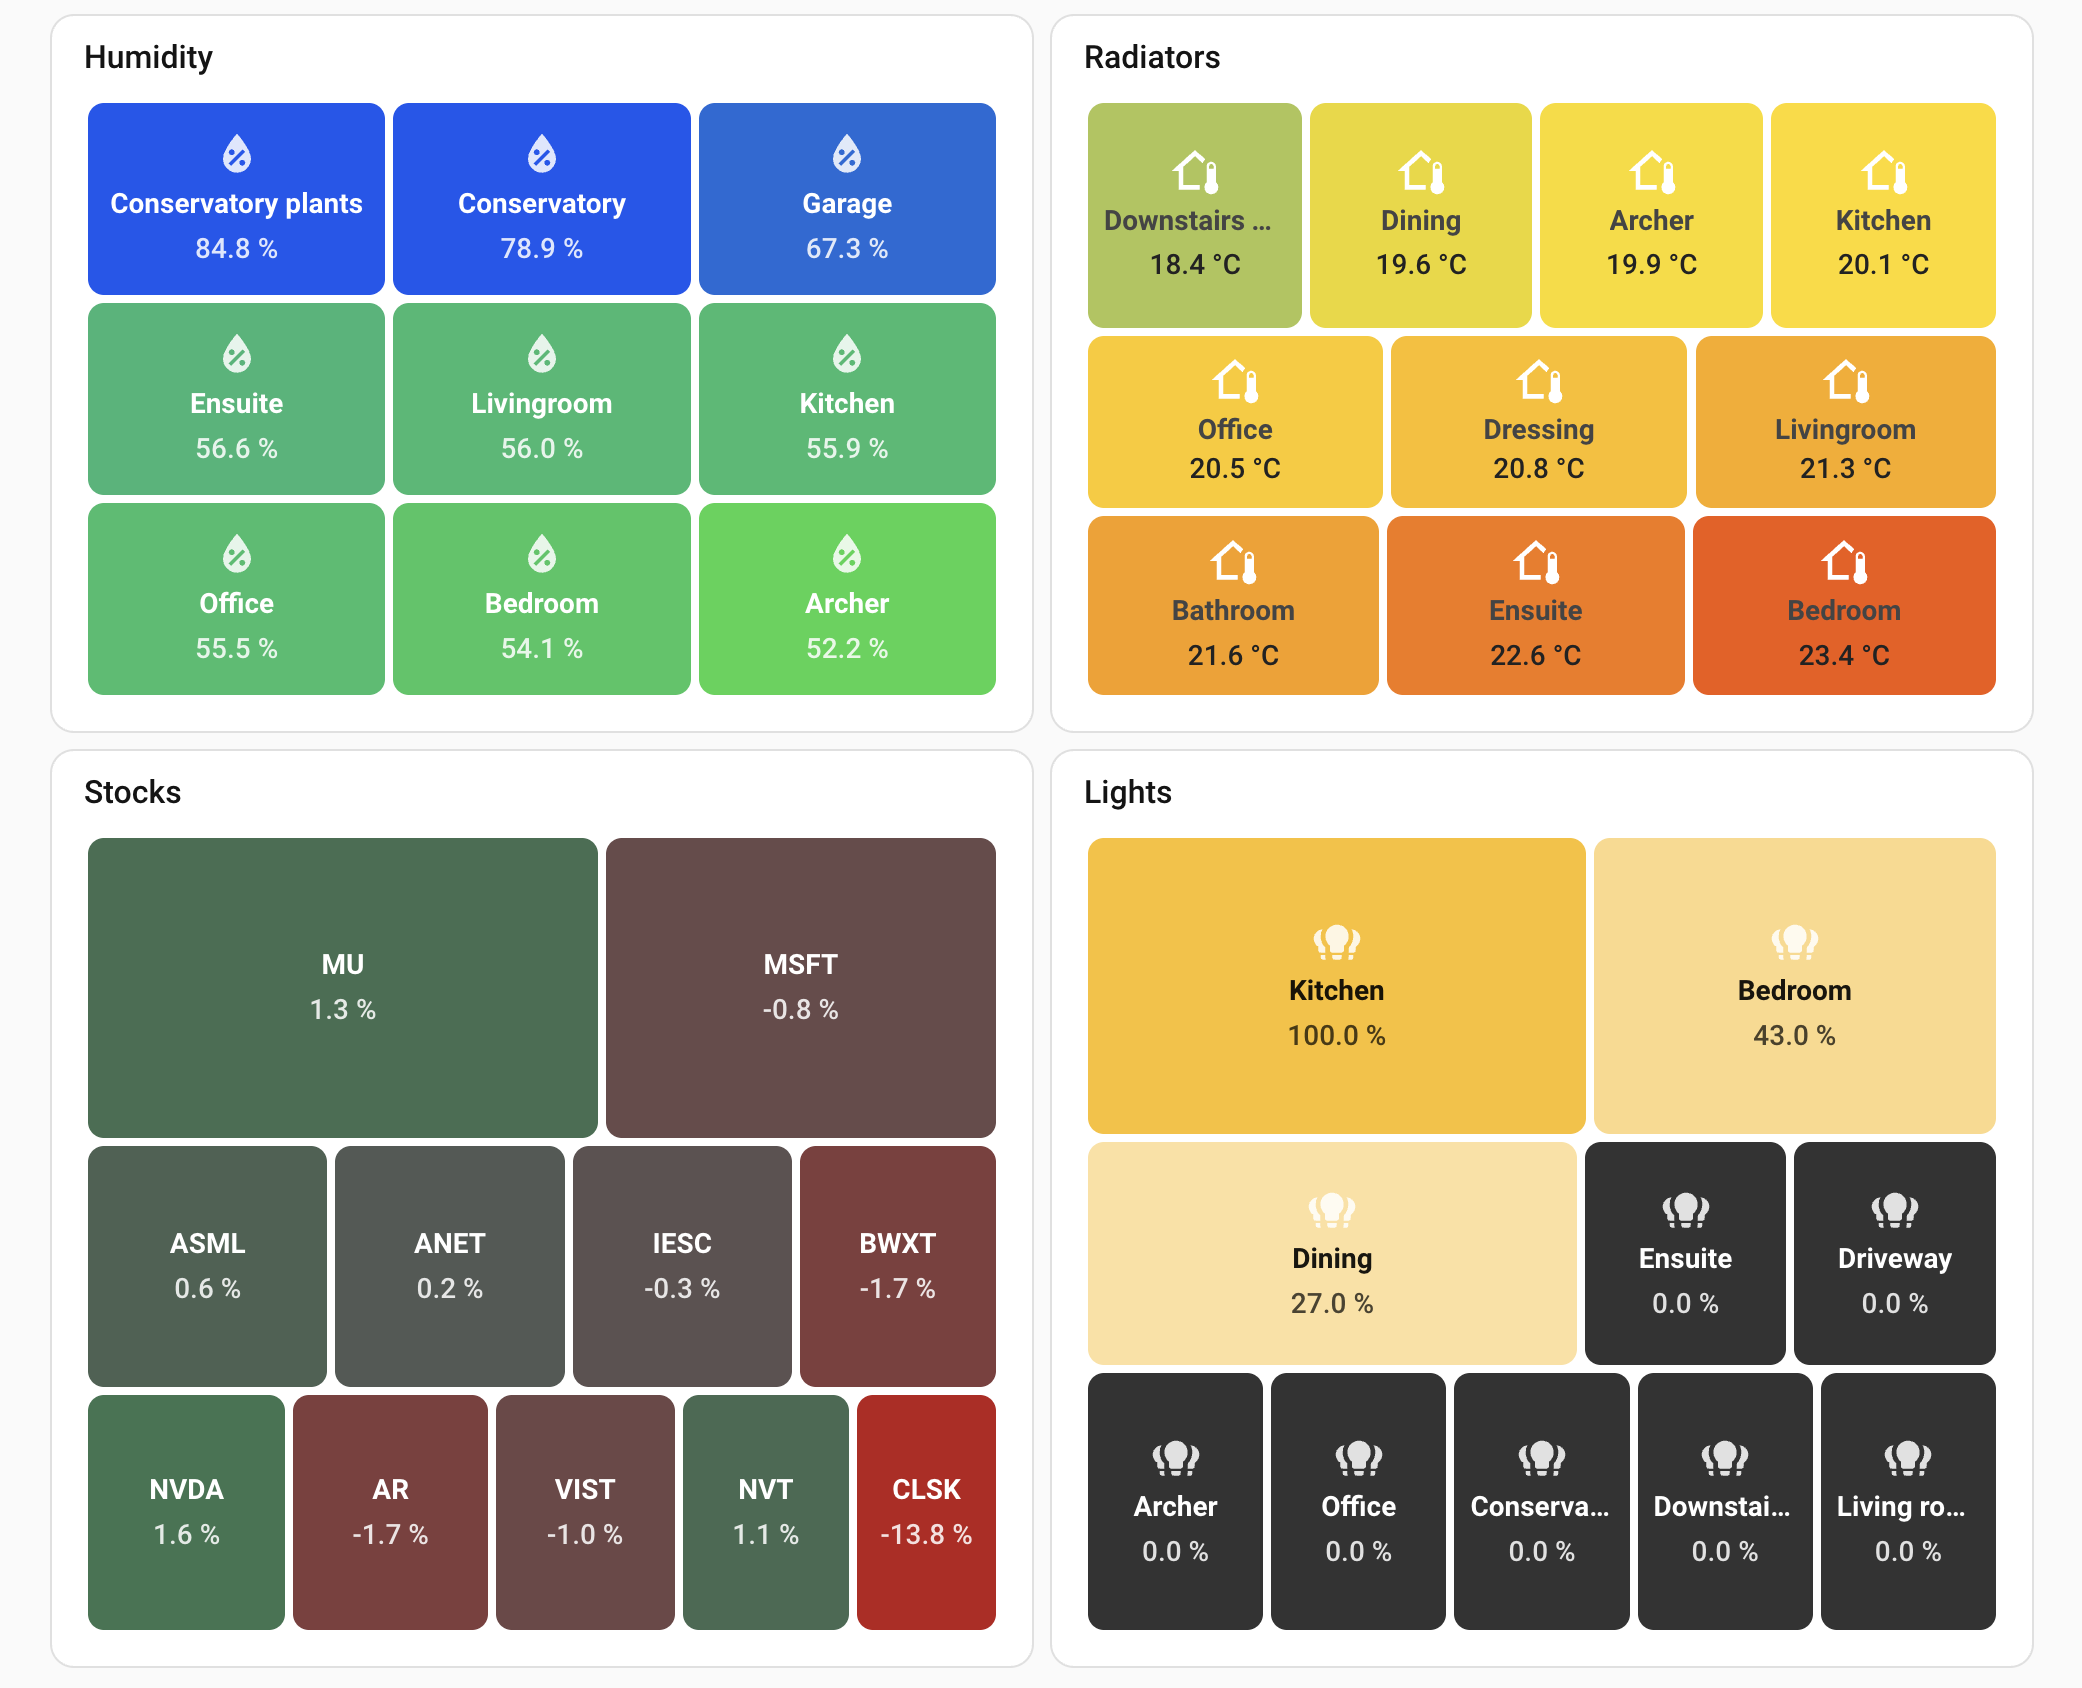
I was looking for a solution to have a heatmap card for my investments as well as visually show anomalies across many entities (humidity, servers resources, etc.) and ended up building my own card. Thought I’d share it with others who might find it useful.
Very nice @omachala
I was searching for a treemap solution and this looks very nice.
Have you thought about implementing a solution for individual scales for different entities? Cases for me would be when temperatures, where I want to check that everything is good with a glimpse, but the ranges are quite different for my workshop and my livingroom.
Another case is energy consumption - I would like to immediately see what is out of the ordinary that is also completely different scales for different meters.
Hi, first of all: Amazing work, I was looking for something like this for quite a while.
I have a little suggestion, but I dont know how much work that would be to implement.
I have a usecase that could benefit from a fixed order of values. So that I can set wich entity is the first one (top left) and the second one, and so on.
On the bottom left Image it looks like you have something similar working, at least the the percentages are not strictly decreasing. Is there a trick to that? I could not get it to work.
Thanks for the suggestion, Johan! I totally understand the use case - different sensors with different normal ranges can be tricky to visualize together.
I’ll think about whether there’s a way to support this while staying true to the treemap concept. The challenge is that treemaps are meant to show comparable values - if each entity has its own scale, visual comparison becomes difficult. But your use case is valid, so I want to explore if there’s a good solution.
I understand the use case for wanting consistent positioning. I’ll explore whether there’s a way to implement this without breaking the core treemap algorithm, which positions items by size for optimal layout. It’s a bit tricky since size-based positioning is fundamental to how treemaps work, but I want to think through your requirements.
Big update today - tap and hold actions are finally here in v0.15.0!
Was one of the things I promised in the original post and I’m pretty happy with how it turned out. Every tile now responds to tap and hold, and the best part - it uses the exact same Interactions panel that native HA components like the tile card and button card use. So you get the full action picker with all the options, confirmation dialogs, navigation, service calls, voice assistant - everthing, out of the box.
You can also set per-entity overrides if you want diffrent tiles to do different things. Really usefull if you have a lights treemap and want most tiles to toggle on tap, but one specific light to navigate to a dedicated view instead.
The visual editor has a proper Actions section now too, no need to fiddle with YAML if you don’t want to.
ok delete the old request as I got it working. Now I have a real niggle! How do I get the boxes to stay in a particular shape? I have 12 panels with 6 inverters and they are appear in 5 rows of 5 with an odd space, not 6x2 which is the correct mapping to the real deployment and perfectly rectangular, The layout doesn’t seem to respect X*Y coordinates.