Thanks for your help. I started from stratch with grafana, but i have the same Problem again. I don´t think the VPN connection is the problem, because the same issue comes, when my mobilephone is connected via local WLAN.
I´m not able to change from http://hass.local:8123/api/hassio_ingress… to http://192.168.x.x:8123/api/hassio_ingress…
Do i make a mistake? Maybe wrong port? The local IP 192… is correct.
Sorry you are having trouble.
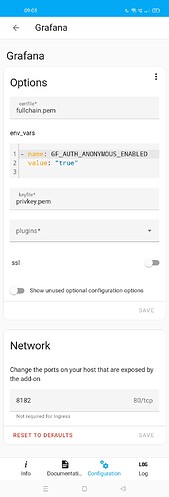
This is my Grafana config below. Probably something minor.
What’s showing in Grafana logs, your answer might be there ?
Thank you @dexstar
I changed the settings, but it doesn´t work.
Here is the log-file:
s6-rc: info: service s6rc-oneshot-runner: starting
s6-rc: info: service s6rc-oneshot-runner successfully started
s6-rc: info: service fix-attrs: starting
s6-rc: info: service fix-attrs successfully started
s6-rc: info: service legacy-cont-init: starting
cont-init: info: running /etc/cont-init.d/00-banner.sh
-----------------------------------------------------------
 Add-on: Grafana
 The open platform for beautiful analytics and monitoring
-----------------------------------------------------------
 Add-on version: 8.1.0
 You are running the latest version of this add-on.
 System: Home Assistant OS 9.5  (aarch64 / raspberrypi4-64)
 Home Assistant Core: 2023.2.5
 Home Assistant Supervisor: 2023.02.dev0901
-----------------------------------------------------------
 Please, share the above information when looking for help
 or support in, e.g., GitHub, forums or the Discord chat.
-----------------------------------------------------------
cont-init: info: /etc/cont-init.d/00-banner.sh exited 0
cont-init: info: running /etc/cont-init.d/01-log-level.sh
cont-init: info: /etc/cont-init.d/01-log-level.sh exited 0
cont-init: info: running /etc/cont-init.d/02-set-timezone.sh
[11:20:35] INFO: Configuring timezone
cont-init: info: /etc/cont-init.d/02-set-timezone.sh exited 0
cont-init: info: running /etc/cont-init.d/grafana.sh
cont-init: info: /etc/cont-init.d/grafana.sh exited 0
cont-init: info: running /etc/cont-init.d/nginx.sh
cont-init: info: /etc/cont-init.d/nginx.sh exited 0
s6-rc: info: service legacy-cont-init successfully started
s6-rc: info: service legacy-services: starting
services-up: info: copying legacy longrun grafana (no readiness notification)
services-up: info: copying legacy longrun memcached (no readiness notification)
services-up: info: copying legacy longrun nginx (no readiness notification)
s6-rc: info: service legacy-services successfully started
[11:20:37] INFO: Starting Memcached...
[11:20:37] INFO: Starting Grafana...
[11:20:37] INFO: Setting GF_AUTH_ANONYMOUS_ENABLED to true
Grafana server is running with elevated privileges. This is not recommended
logger=settings t=2023-02-18T11:20:37.790055557+01:00 level=info msg="Starting Grafana" version=9.2.4 commit=64017e8ca6 branch=HEAD compiled=2022-11-08T11:38:42+01:00
logger=settings t=2023-02-18T11:20:37.791195982+01:00 level=info msg="Config loaded from" file=/usr/share/grafana/conf/defaults.ini
logger=settings t=2023-02-18T11:20:37.791262388+01:00 level=info msg="Config loaded from" file=/etc/grafana/grafana.ini
logger=settings t=2023-02-18T11:20:37.791281462+01:00 level=info msg="Config overridden from Environment variable" var="GF_AUTH_ANONYMOUS_ENABLED=true"
logger=settings t=2023-02-18T11:20:37.791300962+01:00 level=info msg="Path Home" path=/usr/share/grafana
logger=settings t=2023-02-18T11:20:37.791315313+01:00 level=info msg="Path Data" path=/data
logger=settings t=2023-02-18T11:20:37.791330572+01:00 level=info msg="Path Logs" path=/var/logs/grafana
logger=settings t=2023-02-18T11:20:37.791352276+01:00 level=info msg="Path Plugins" path=/var/lib/grafana/plugins
logger=settings t=2023-02-18T11:20:37.791380349+01:00 level=info msg="Path Provisioning" path=/usr/share/grafana/conf/provisioning
logger=settings t=2023-02-18T11:20:37.791395405+01:00 level=info msg="App mode production"
logger=sqlstore t=2023-02-18T11:20:37.79315143+01:00 level=info msg="Connecting to DB" dbtype=sqlite3
logger=migrator t=2023-02-18T11:20:37.864274017+01:00 level=info msg="Starting DB migrations"
logger=migrator t=2023-02-18T11:20:37.883615669+01:00 level=info msg="migrations completed" performed=0 skipped=452 duration=1.818228ms
logger=plugin.loader t=2023-02-18T11:20:38.110517347+01:00 level=info msg="Plugin registered" pluginID=input
logger=plugin.finder t=2023-02-18T11:20:38.110744732+01:00 level=warn msg="Skipping finding plugins as directory does not exist" path=/var/lib/grafana/plugins
logger=secrets t=2023-02-18T11:20:38.111469368+01:00 level=info msg="Envelope encryption state" enabled=true currentprovider=secretKey.v1
logger=query_data t=2023-02-18T11:20:38.116611743+01:00 level=info msg="Query Service initialization"
logger=live.push_http t=2023-02-18T11:20:38.130527451+01:00 level=info msg="Live Push Gateway initialization"
logger=infra.usagestats.collector t=2023-02-18T11:20:38.765386282+01:00 level=info msg="registering usage stat providers" usageStatsProvidersLen=2
logger=provisioning.alerting t=2023-02-18T11:20:38.767440895+01:00 level=info msg="starting to provision alerting"
logger=provisioning.alerting t=2023-02-18T11:20:38.767504876+01:00 level=info msg="finished to provision alerting"
logger=ngalert t=2023-02-18T11:20:38.768802835+01:00 level=info msg="warming cache for startup"
logger=grafanaStorageLogger t=2023-02-18T11:20:38.782128923+01:00 level=info msg="storage starting"
logger=http.server t=2023-02-18T11:20:38.781872816+01:00 level=info msg="HTTP Server Listen" address=[::]:3000 protocol=http subUrl=/api/hassio_ingress/ctAMyeFVcA8Zg6v3pXhPLOjcUQ4y61zgbe0ie-eSEU8 socket=
logger=ngalert.multiorg.alertmanager t=2023-02-18T11:20:38.792647689+01:00 level=info msg="starting MultiOrg Alertmanager"
logger=ticker t=2023-02-18T11:20:38.792659948+01:00 level=info msg=starting first_tick=2023-02-18T11:20:40+01:00
[11:20:38] INFO: Starting NGINX...
Maybe try changing the log_level to debug in configuration and see if anything shows then ?
What device are you running HA on ?
Hello,
sorry for my late response. I didn´t use these dashboards some days. Now i get the “401: Unauthorized” error on PC and mobile device…
A full restart didn´t help.
Edit: I opened the dashboard via Grafana in HA and the the dashboard from the card works on PC not on the mobile device. On the mobile Device I still have the 401-Error.
@ dextar
Thank you for your help!!!
What screenshot do you need? When I use Open Web UI everything works.
I don´t know where I can find the logs under web ui.
Sorry it’s not working for you and I’m not really sure what else for you to try.
If everything is setup correctly, you have data being logged by Influx/Grafana, you’re able to create a dashboard in Grafana, no errors in any logs, you’ve cleared cache and restarted.
The last time I saw the 401 error, I just rebooted HA from that device and ever since it’s been working perfectly fine, on PC and mobile devices.
Hope you get it working 
Do share if you do, it may help someone else in the future.
All the best 
@dexstar hey… I followed your directions until step “Open your browser and navigate to your HA with the port you have set.” – there I’m presented with a Grafana login, but my HASS credentials don’t work, neither can I create an account within Grafana (as it’s hosted I suppose)
What do I need to do?
Cool but now it wants a login username and password for grafana on the linked page?
Hi Warrender, and other future people with the same problem (as this post in already 1 year old),
I noticed your settings above show Grafana using port 3000; but the URL (generated by Grafana) you try to access uses port 8123. Try putting 3000 in the URL rather than 8123? That fixed the problem for me. Maybe Grafana has a bug when generating the URL, that it doesn’t automatically put in the right port?
Cheers!


