Tutorial to fix 401: Unauthorised Error with Grafana for mobile devices

Hope this helps someone down the road.

First of all I am in no way an expert in any of these amazing software: InfluxDB, Grafana or Home Assistant.

Credit goes to the gifted minds of those applications that provide to us such amazing tools.

This is my guide to fix the 401 error on mobile devices. I’m a visual person, so that’s what you’ll
get.

Required:
1: Awesome Home Assistant
2: InfluxDB
3: Grafana
4: Hit = Clicking the mouse button :wink:

OK, lets rock:

In HA, navigate to Supervisor Tab and select Grafana.

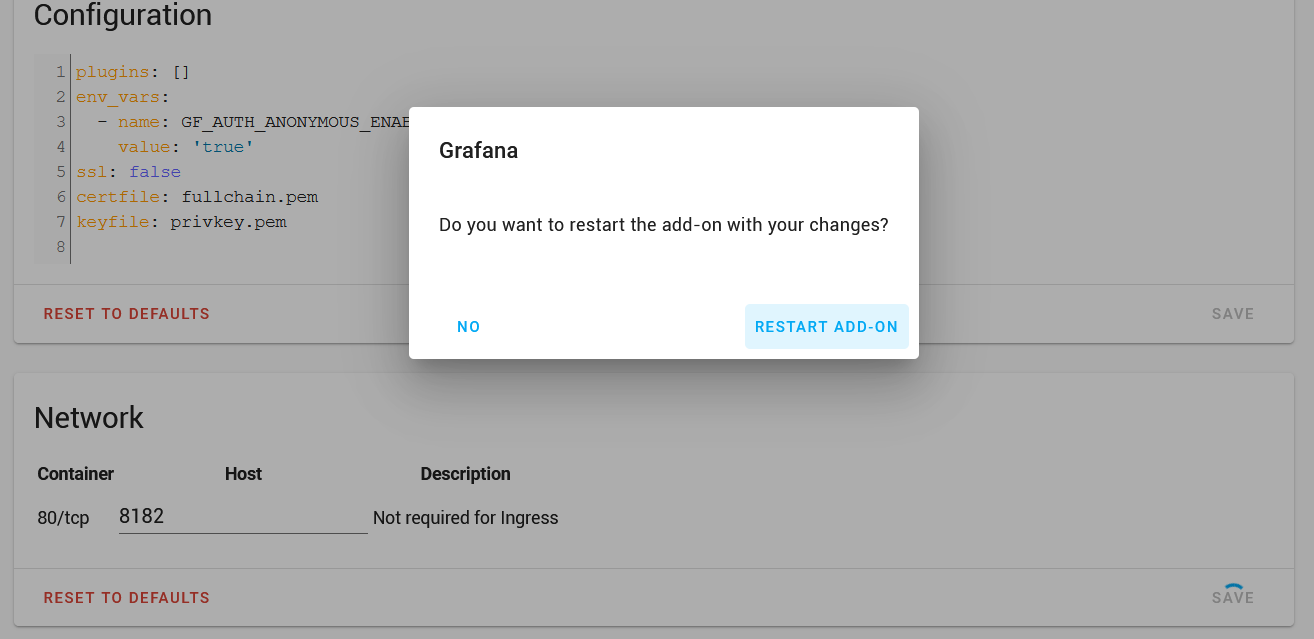
Set these options in Configuration. I am using port 8182; but you can use any FREE port.

Save and restart addon.

Open your browser and navigate to your HA with the port you have set.

You should see this screen and it should be all downhill from here.

Click on the 4 boxes and select Manage. Select your dashboard.

Hit the share icon. Set options and copy link to notepad.

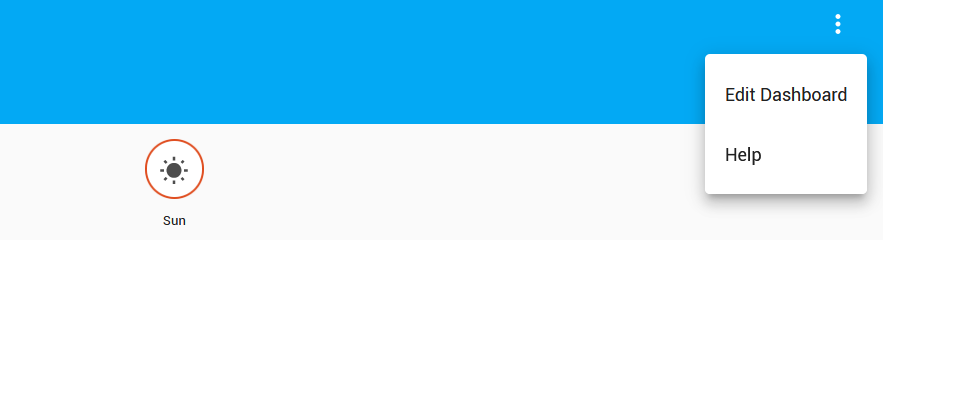
In HA select the 3 dots to Edit Dashboard.

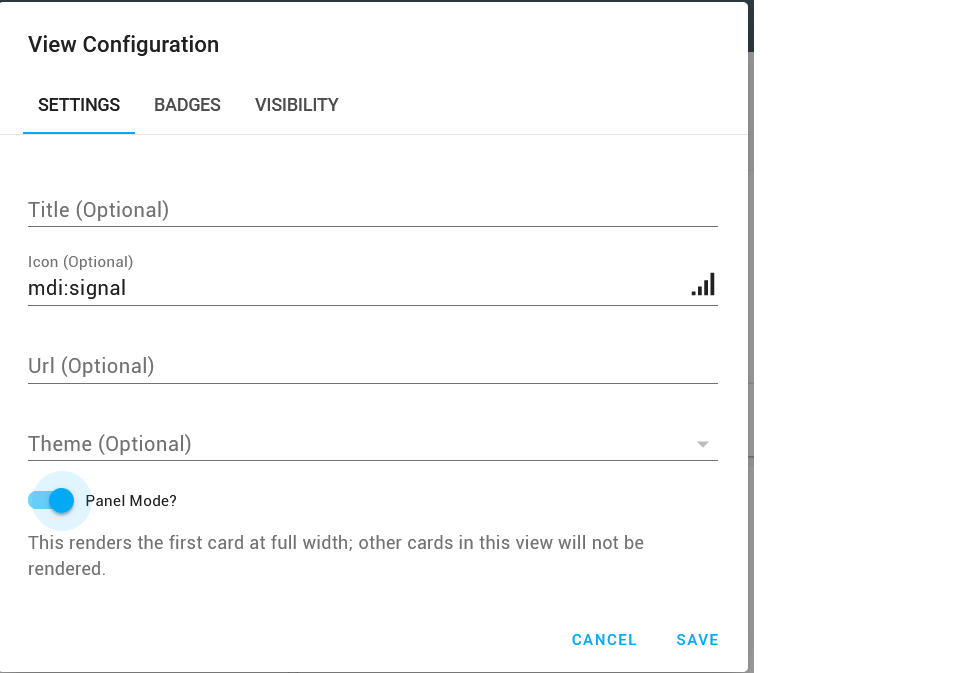
Hit the + icon. Select options to suit yourself and Save.

Hit the + icon and select Webpage Card.

Paste the link from notepad and you should now be golden.

But wait there’s more …let’s pimp it up a bit… remember that link you have in Notepad. Add &kiosk to the link in the previous step.

The beauty of InfluxDB,Grafana and HomeAssistant on your mobile devices.

Enjoy. :+1:

18 Likes

Will this work for https (duckdns)?

Though I don’t think it is required in that case, the side panel ingress link works perfectly on mobile.

1 Like

Not sure image . Could you post some screens with/without duckdns so I can update OP.

I’m happy just using the side menu. It works on mobile.

Awesome. :ok_hand:

Thanks a lot, It was very helpful ! :+1:

2 Likes

It work for me, but only in local network. I do not view grafs from internet. In my oppinion it is not secure to use anonymous accees to grafana from whole internet.
You can make it work from anywhere:

  1. if you use https on HA (in duckduck cake you do so), you need to use https on grafana.
  2. You need to use port forvading on your router to grafana port

OK, works but looks like you have the “door closed” and use the window instead … to enter in HA

it works!

port forward router:
443 to 8123 tcp
and
80 to 3000 tcp
and grafana setings:

plugins: []
env_vars:
  - name: GF_AUTH_ANONYMOUS_ORG_NAME
    value: Main Org.
  - name: GF_AUTH_ANONYMOUS_ENABLED
    value: 'true'
  - name: GF_AUTH_DISABLE_LOGIN_FORM
    value: 'false'
ssl: false
certfile: fullchain.pem
keyfile: privkey.pem
4 Likes

I created a login account on this community only to thank u!
This is the only solution that solved my issues with grafana on lovelace!
Thank you!!!

1 Like

No problem :+1: welcome to forum too.

I also created a login account on this community to thank you!
This was very useful, and worked. This problem was a thorn in my eye :wink:
Thanks a lot!

1 Like

Did work it for you all on your own domain or you just dealt with a problem that other devices on the local network did not show the grafana panels? I cannot make it work. Using domain, synology nas for running ha, reverse proxy from my subdomain. Grafana returns 401 unauthorized. If I make her own domain, I see just blank white window

Just for devices on my local network.

Hello,

is there an update for the current ha version?
unfortunately this doesn’t work for me. Where did I make the mistake?
I configured it like this. I can’t find the “Template variables” item in Grafana.

Edit: My mobile device is connect via VPN to HA.

Hello my friend, just did a quick test of this and can confirm that all is good on my end with latest version of everything.

I am assuming that you have everything installed and working fine.

That was how it looked from an older version of Grafana.

Once you have a dashboard created and saved …

Hit the share icon … and copy the URL link

Follow the other steps and paste into a Webpage Card, you should hopefully get this …

g3

As for accessing via VPN, I don’t use and am unable to help there.

All the best and do update how you get along.

:+1:

1 Like

Thanks a lot for your help. Unfortunately I could not fix the error. Maybe something is wrong with my Grafana configuration?
Today I got the 401 error on my PC. Once I opened the dashboards in Grafana, I was then able to see the dashboards again on the Webpage Card.

2 Likes

Sorry you are having trouble, maybe try doing things again from the beginning if possible ?

Everything is working here on my end with the latest version of everything like shown.

Probably something minor.

Update how you get along :crossed_fingers:

1 Like

I had the same problem, worked on Pc not on moble or tablet Both Android,
Changed the ip to full adress from the local , now working on mobile not Pc .
did all sugestions as above , in end simply made 2 dashboards one called mobile grapths other called Pc Grapths. dependingon device made one visible and other hidden.
works a treat, as they say “Simples”

Nice :+1: but mine is working fine with the one dashboard; on all my PC/Mobile/Tablet devices, so not sure why.

Screenshot from HA App.