I think this is quite new, so if anyone’s interested…
The UK Health Security Agency has a free API which carries health alerts. The first of the summer’s heat warnings was issued today, but it also includes warnings about covid, flu etc. Same principle as weather and flood warnings.
The documentation isn’t great but, whilst I found the API metric heat-alert_headline_matrixNumber, I cannot find the path to get to it (beyond https://api.ukhsa-dashboard.data.gov.uk/ as following that path always ends up with historical data.
Perhaps someone else can see what I am missing? …I’ve popped off a request via their feedback page but not holding my breath.
edit: In the interim, if anyone wants to scrape, this is what I am using:
Set for the south-east but just change that in the url. You can work out your area here.
All but sensor.uk_cold_alert & sensor.uk_heat_alert will show as unavailable if there is no alert. I use jazzyisj’s excellent unavailable-entities-sensor and ignore them with a label.
the markdown cards are sensitive to spaces and newlines so copy exactly.
Scrape
scrape: #- restart required for changes ----------------------------------------

  - resource:  https://ukhsa-dashboard.data.gov.uk/weather-health-alerts/cold/south-east
    scan_interval: 86400 # 1/day in secs # default is 600
    sensor:

      - name: "uk_cold_alert"
        unique_id: "uk_cold_alert"
        icon: mdi:thermometer-low
        select: "#main-content > div > div.govuk-grid-row > div:nth-child(2) > div.govuk-grid-row > div > dl > div:nth-child(2) > div"
        value_template: "{{ value }}"

      - name: "uk_cold_alert_score"
        unique_id: "uk_cold_alert_score"
        icon: mdi:thermometer-low
        select: "#main-content > div > div.govuk-grid-row > div:nth-child(2) > div.govuk-grid-row > div > dl > div:nth-child(3) > dd"
        value_template: "{{ value }}"

      - name: "uk_cold_alert_liklihood"
        unique_id: "uk_cold_alert_liklihood"
        icon: mdi:thermometer-low
        select: "#main-content > div > div.govuk-grid-row > div:nth-child(2) > div.govuk-grid-row > div > dl > div:nth-child(5) > dd"
        value_template: "{{ value }}"

      - name: "uk_cold_alert_start"
        unique_id: "uk_cold_alert_start"
        icon: mdi:thermometer-low
        select: "#main-content > div > div.govuk-grid-row > div:nth-child(2) > div.govuk-grid-row > div > dl > div:nth-child(6) > dd"
        value_template: "{{ value }}"

      - name: "uk_cold_alert_end"
        unique_id: "uk_cold_alert_end"
        icon: mdi:thermometer-low
        select: "#main-content > div > div.govuk-grid-row > div:nth-child(2) > div.govuk-grid-row > div > dl > div:nth-child(7) > dd"
        value_template: "{{ value }}"

  - resource:  https://ukhsa-dashboard.data.gov.uk/weather-health-alerts/heat/south-east
    scan_interval: 86400 # 1/day in secs # default is 600
    sensor:

      - name: "uk_heat_alert"
        unique_id: "uk_heat_alert"
        icon: mdi:thermometer-high
        select: "#main-content > div > div.govuk-grid-row > div:nth-child(2) > div.govuk-grid-row > div > dl > div:nth-child(2) > div"
        value_template: "{{ value }}"

      - name: "uk_heat_alert_score"
        unique_id: "uk_heat_alert_score"
        icon: mdi:thermometer-high
        select: "#main-content > div > div.govuk-grid-row > div:nth-child(2) > div.govuk-grid-row > div > dl > div:nth-child(3) > dd"
        value_template: "{{ value }}"

      - name: "uk_heat_alert_liklihood"
        unique_id: "uk_heat_alert_liklihood"
        icon: mdi:thermometer-high
        select: "#main-content > div > div.govuk-grid-row > div:nth-child(2) > div.govuk-grid-row > div > dl > div:nth-child(5) > dd"
        value_template: "{{ value }}"

      - name: "uk_heat_alert_start"
        unique_id: "uk_heat_alert_start"
        icon: mdi:thermometer-high
        select: "#main-content > div > div.govuk-grid-row > div:nth-child(2) > div.govuk-grid-row > div > dl > div:nth-child(6) > dd"
        value_template: "{{ value }}"

      - name: "uk_heat_alert_end"
        unique_id: "uk_heat_alert_end"
        icon: mdi:thermometer-high
        select: "#main-content > div > div.govuk-grid-row > div:nth-child(2) > div.govuk-grid-row > div > dl > div:nth-child(7) > dd"
        value_template: "{{ value }}"
The result are 2 cards that compliment the Severe Weather Warnings from this thread (The heat card is the bottom one, the Severe Weather Warning is the top one).
Just poking around behind the scenes of the UKHSA data dashboard—basically opening up developer tools in the browser and checking out the network traffic. Sometimes you get lucky and find a proper API, but no such luck with this one.
The UKHSA API might still be under development. There are API docs showing a public API v2. But, when I navigate the tree, I can’t yet find a sub_theme for heat or cold alerts.
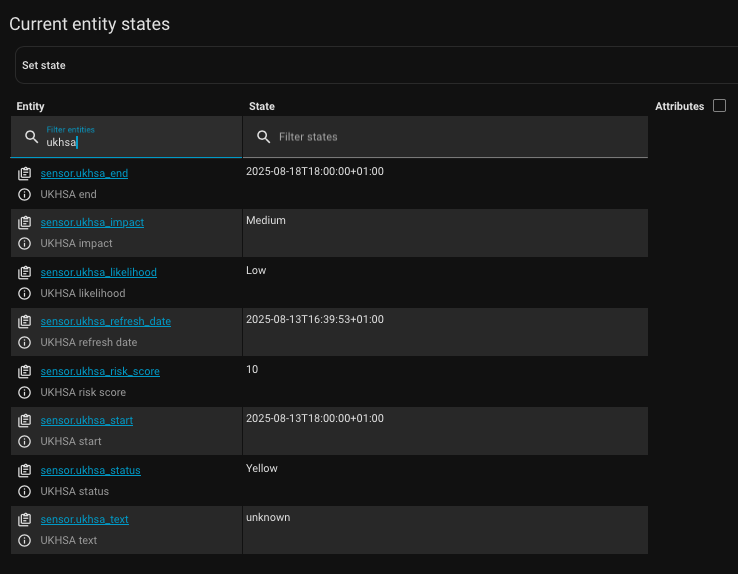
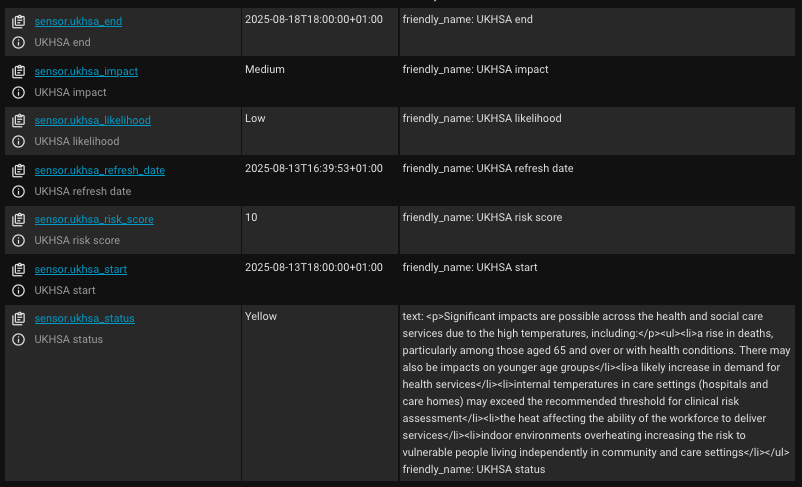
…need to fix sensor.ukhsa_text (the text is >255 characters), but this will get you started.
edit: for anyone else, here are some of the regions:
E12000001 North East
E12000002 North West
E12000003 Yorkshire and The Humber
E12000004 East Midlands
E12000005 West Midlands
E12000006 East of England
E12000007 London
E12000008 South East
E12000009 South West
Perfect, thank you so much for your help. I have it working now following your instructions and I am displaying it on the dashboard using a slightly modified version of the card you are using in the scrape version. Thanks again.
The start and end times (the two sensors in the card where ukhsa is at the end of the name rather than the beginning) are template sensors i used to format the date and time how I wanted it. Below is an example of the start time sensor.
Great! I also added the risk, location etc, and like your date formatting.
I removed the text as I suspect it is always the same (or similar):
Edit: You can also format the dates without creating 2 new sensors. Add the following after the {% set heat = states('sensor.ukhsa_heat_status') %} line
{% set start = states('sensor.ukhsa_heat_start')|as_timestamp|timestamp_custom('%A %-d %B %Y at %I:%M %p') %}
{% set end = states('sensor.ukhsa_heat_end')|as_timestamp|timestamp_custom('%A %-d %B %Y at %I:%M %p') }}
Then use those variables instead: from: **{{ start }}** <br />to: **{{ end }}** |