The basic energy equation, if you have solar but no battery, is
Consumption = Solar + Import - Export
which the HA Energy Dashboard solves, for Consumption, based on the three energy sensors for solar energy, grid import energy, and grid export energy.
Working backwards, the 'Untracked' is simply all (calculated) Consumption less the sum of all the tracked items. This should work well, but clearly if the calculated consumption is too big, then there will be more untracked. If the calculated consumption is too small, then the untracked is reduced and may even not be there.
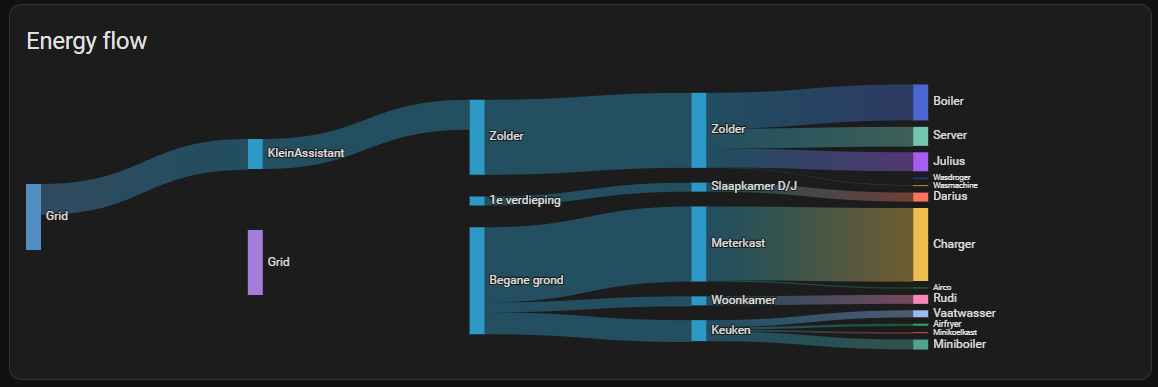
A (one) simple answer to your first graph is that solar is missing. Hence Consumption is too small (being just the grid import) and there is more tracked than (apparently) consumed, hence no untracked.
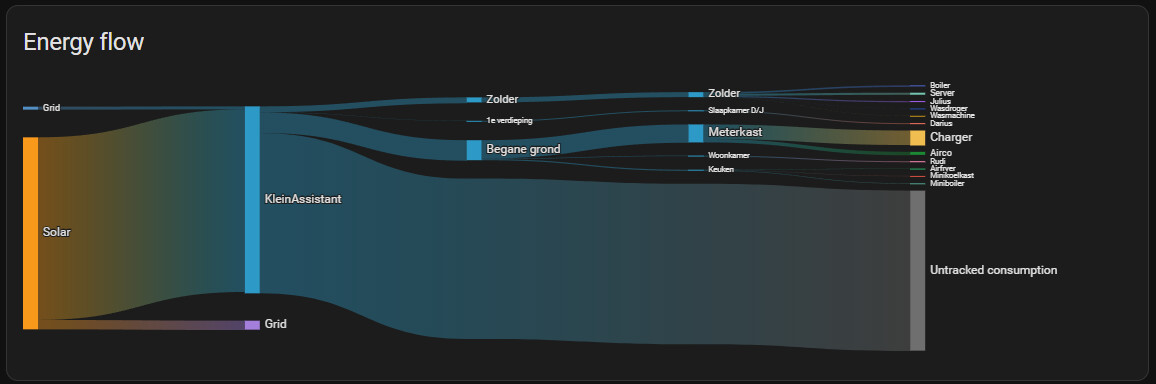
Likewise, for your second graph, there is either too much solar or not enough grid export, meaning that there is more Consumption than there should be, hence more untracked consumption.
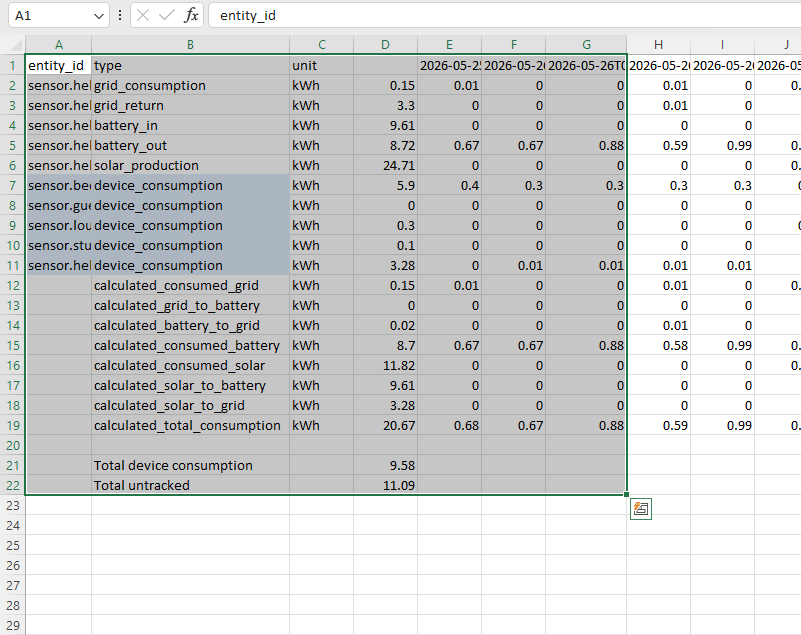
The Energy Dashboard has a menu option to download all the data, which can be found on the first page, in the date selector box side menu. This will download a csv file with all the figures. You will get a column for every 5 minutes, but since these graphs only use the hourly stats, only every 12th column will have data in it. This provides the raw entity values, and the calculations done in stages to work out the total consumption.
This file does require picking out the bits you want, and adding a row sum, but it will provide the full period figures. Hence for yesterday, here is the critical part of the data for my electricity.
The untracked is just the calculated total consumption less the sum of the tracked items. And this is just what is plotted.
If you find that the tracked energy is greater than the consumption, or the consumption is much greater than you expect, then it is a case of going through each hour to find which, if any, are not correct.
Possibly the tracked is being double counted somewhere, so is too big. If I were to place a bet, then I would go for an issue with your solar sensor. If this goes unavailable for a time, then solar will be reduced, consumption reduced, and you get the first graph. If it then comes back and gets counted all in one go, solar is increased, consumption increased, and you get the second graph.