Utility_meter cyles

Hi @Giovanni85,

Yes, you should use the sensor p1_meter_active_power as starting point.

If this sensor can be positive (grid consumption) and negative (solar production), then you must convert it to get only the positive part and 0 if it is negative.
This new sensor is then the starting point for the Riemann sum integration.

I have two sensors, giving me the production of solar power and the current consumption of the house. Via a template sensor, I get a new sensor.smappeemqtt_grid_consumption.
This sensor is then used in the Riemann sum integration.

    smappeemqtt_grid_consumption:
      friendly_name: Grid afname
      unit_of_measurement: "W"
      value_template: >-
        {%- if states("sensor.smappeemqtt_huidige_opbrengst") | float < states("sensor.smappeemqtt_huidig_verbruik") | float %}
          {{ states("sensor.smappeemqtt_huidig_verbruik") | float - states("sensor.smappeemqtt_huidige_opbrengst") | float }}
        {%- elif states("sensor.smappeemqtt_huidige_opbrengst") | float > states("sensor.smappeemqtt_huidig_verbruik") | float %}
          {{ 0 | float }}
        {% endif %}

Hi, I started this similar thread on Reddit before I spotted this discussion. Would my approach be a good one too?

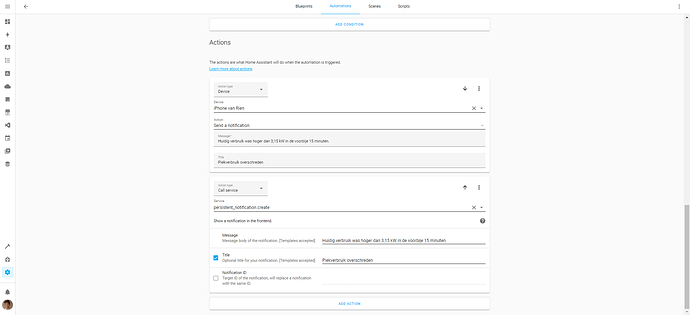
My approach is teh following using a 3.15 kWh limit as said here Het capaciteitstarief: wat er verandert | Energie-Vergelijker.be using the below in my configuration file:

template2

and followed by this automation


And this dashboard

3.15kWh? See article

Indeed. That’s per 15 minutes, so if you fire up your car charger or electrical furnace …

Dear can you please provide the full/complete config yaml for the first option/ way to calculate the piek consumption. Whatever I adjusted in the coding it keeps giving errors or HA refuses to restart ….

Tx, Wim

Hi @ew-ewim, what are the errors you get when restarting or checking your config?

My config is spread over several configuration files. The code in my topic above is a copy-paste from these files, so the syntax must be correct.

So let start with the error messages you get when checking the configuration. Please post the complete error here.
In which version of HA are you working?

Dear Evb, tx for your reaction and reaching out. Seams that I took your instructions literally and added them as posted and sequentially in the config yaml. Forgot to add the avg peak cons/quarter to the sensors defined. Seems Ok now.
Another question however: on your implementation I am missing the history of the avg peak cons/quarter opposed to the solution of Giel?

Hi @ew-ewim, you are correct, I’ve no history in HA itself. At that time I didn’t know anything about input_numbers :frowning:
So I used InfluxDB 2.0 for that. All HA values that I want to grep, are sent to the influxDB.
InfluxDB is an efficient system to store time series data : https://www.influxdata.com/
And I did the quarterhour query inside InfluxDB.

The HA configuration to send the data from HA to InfluxDB:

# move long living data to the influxDB
influxdb:
  api_version: 2
  ssl: false
  host: localhost
  port: 8086
  token: YourToken
  organization: YourOrganization
  bucket: homeassistant
  tags:
    source: HA
  tags_attributes:
    - friendly_name
  precision: ms
  default_measurement: units
  exclude:
    entity_globs:
      - sensor.nmbs_*
      - sensor.recycleapp*
      - sensor.br*
    entities:
      - sensor.last_boot
      - sensor.date
      - sensor.time
      - sensor.time_utc
      - sensor.worldclock_sensor
      - sensor.dayoftheweek
      - sensor.date_long
      - sensor.date_time
      - sensor.internet_time
      - sensor.moon
      - sensor.moon_phases
      - sensor.nmbs
      - sensor.hacs
      - sensor.distance_sensor_1_1
      - sensor.distance_sensor_2_1
    domains:
      - persistent_notification
      - person
  include:
    entities:
      - weather.home
    domains:
      - sensor
      - binary_sensor

I’m using InfluxDB also for the graphical output. Others are using Grafana. Grafana should give more possibilities for the graphics, but I didn’t test it yet.
This is mine InfluxDB configuration/query:

maxAverageQuarterHourData = from(bucket: "homeassistant")
  |> range(start: v.timeRangeStart, stop: v.timeRangeStop)
  |> filter(fn: (r) => r["friendly_name"] == "Gemiddeld piekvermogen per kwartier")
  |> filter(fn: (r) => r["_field"] == "value")
  |> filter(fn: (r) => r["_measurement"] == "kW") 
  |> aggregateWindow(every: 15m, fn: max, createEmpty: false)
  |> yield(name: "maxAverageQuarterHour")

maxMonthData = maxAverageQuarterHourData
  |> aggregateWindow(every: 1mo, fn: max, createEmpty: false) 
  |> yield(name: "maxMonth")

maxMonthData
  |> aggregateWindow(every: 1y, fn: mean, createEmpty: false) 
  |> yield(name: "averageYear")

Because I’m also logging in InfluxDB the raw value of the consumption power, I can also directly calculate or query this raw value of the power

averageQuarterHourData = from(bucket: "homeassistant")
  |> range(start: v.timeRangeStart, stop: v.timeRangeStop)
  |> filter(fn: (r) => r["friendly_name"] == "Grid afname")
  |> filter(fn: (r) => r["_field"] == "value")
  |> filter(fn: (r) => r["_measurement"] == "W") 
  |> aggregateWindow(every: 15m, fn: mean, createEmpty: false)
  |> yield(name: "averageQuarterHour")

maxMonthData = averageQuarterHourData
  |> aggregateWindow(every: 1mo, fn: max, createEmpty: false) 
  |> yield(name: "maxMonth")

maxMonthData
  |> aggregateWindow(every: 1y, fn: mean, createEmpty: false) 
  |> yield(name: "averageYear")

The two graph results are quasi equal to each other.
There are differences that I cannot always explain, but probably it is due to a reboot of my NAS (I’m running HA in a virtual environment), a reboot of HA itself after the installation of a new version, sometimes the connection between HA and InfluxDB is broken (InfluxDB is running in another virtual system), etc…

I’ve now running the 3 solutions next to each other fore one month and for November I can say that the peak is identical for the three.

2 Likes

Hey tx for sharing. So far I have not setup anything to store historical data or do additional calculations on. I will definitely look into this!

It’s in the national news…the new capacity tarif, however it seens politics will push to have the impleetation delayed due to the incredible high energy prices: Wie weinig stroom verbruikt kan tot 100 euro meer betalen door capaciteitstarief | VRT NWS: nieuws

Has anyone been successfull in monitoring with HA if they went above the capacity limit?

Giel, thanks for sharing your code !

I implemented most of what is made available here.
One thing, I don’t understand about the template sensor sensor.max_peak_2

Where is this one reset to 0 ?

I see you reset the input_number in your sequence every month:

          - service: input_number.set_value
            target:
              entity_id: input_number.max_peak_2
            data:
              value: 0.1

but I would expect that the sensor also should start at 0 every month?

What am I missing?

Hi @verbruggher
One example of previous night.
I still have a reversing counter!, so the sensor values are coming from a Smappee device.

2022-02-04HomeAssistant48hKwartierPiek

I’ve a plugin hybride car charging at night with a normal power outlet (44km electric range in ideal circumstances). The charging starts at midnight and ends at 06.00. It charges continuous at ± 10A ==> 10A x 220V = ±2200 kW

I’ve a continuous consumption (pond pumps, 2 NASses, standby consumption, fridge, freezer, …) for about 400W.

At 01.30 you see a peak when the dishwasher starts : 2500 kW

Result of this night: a quarter peak of 5152 kW

Conclusion: In the future, with a digital counter, I can’t program the dishwasher anymore to run at night.
Only charging the plugin hybride car will set me already on the default 2500 kW peak…

I’ve two other ways to also calculate the peaks (see above in the topic, using Influxdb to query the raw data of the sensors)


You see the same results.

I can’t charge the car at work, so it will always be charged obligatory at night, meaning that no other consumption at night can be programmed. What this will give with a full electric car in the future, I don’t know…
Some more information in dutch : Elektrische auto thuis opladen: zoveel kost het in 2022

It will be a puzzle and one mistake of 15 minutes of high power (dishwasher and washing machine together for example) and all your efforts for a low monthly peak will have been for nothing.

1 Like
sequence:
          - condition: template
            value_template: >
              {{  states("sensor.max_peak_2") | float(default=0)> states("input_number.february_peak_2") | float(default=0)}}
          - service: input_number.set_value
            target:
              entity_id: input_number.february_peak_2
            data:
              value: >
                {{ states("sensor.max_peak_2") }}
          - delay:
              seconds: 5
          - service: input_number.set_value
            target:
              entity_id: input_number.max_peak_2
            data:
              value: 0.1
value_template: >
        {% set peak = ((states.sensor.quarter_hourly_grid_consumption.state | float(default=0)) * 4) %}
        {% set max_peak = (states.input_number.max_peak_2.state | float(default=0)) %}
        {% macro max(X, Y) -%} {{X|float if X|float > Y|float else Y|float }} {%- endmacro %}
        {{ max(max_peak, peak) }}

The input_number.max_peak_2 also gets reset every month.
input_number.max_peak_2 gets compared with sensor.quarter_hourly_grid_consumption every time it has changed and sensor.max_peak_2 gets the state of the highest one.

1 Like

Hi guys @JohanBraeken @ygeffens @gieljnssns,

first off, a big thank you for all the effort you guys put in configuring that new kwartierpiekvermogen regulation monitoring (for Belgium) in HA. But I’m struggling putting the final version together which @gieljnssns so kindly took the initiative in. I would love to monitor my piekvermogen too. But all the above separate code snippets and versions made my lose track.

Would there be anyone willing to paste the latest version of code snippets in 1 post? If it’s not to much to ask ofcourse. I just know a lot of people would benefit from a summary post. As it’s a very relevant topic in the near future.

5 Likes

With the current price madness, I also would like to keep better track of my energy costs.
Any update on this?

EDIT: on Fluvius’ website starting next year you’ll be able to see the amounts, so that might be good to verify the calculations?

HI @gieljnssns ,

just to be sure, here is how you defined the sensors in the config.yaml file, correc?

sensor:
  - platform: template
    sensors:
      max_peak:

yes I did it like that

Thank you so much @gieljnssns ,

did you made any change/adjustment since last version you shared here?

https://community.home-assistant.io/t/utility-meter-cyles/224576/34

I’m trying it today and I would like to pickup the latest and the greatest :smiley:

I think I haven’t made any changes…
You can always have a look in my config My-Hassio-config/config at master · gieljnssns/My-Hassio-config · GitHub

With the start of the capaciteitstarief only a few weeks a way from now. Has anyone made a automation to keep the peak low? I made something simple that shuts down a few appliances when the Actual Power Consumption is above 4000kw for 10 minutes. It switches the dishwasher, boiler ans dryer of, and back on after 10 minutes.