The energy dashboard takes more than a minute to display the bar graphs and every-time I switch month/day the loading takes 1 minutes again. Everything else is very responsive.
I’m using a Raspberry Pi 5 with NVME disk as the host. It is a docker install:
Méthode d'installation Home Assistant Container
Core 2025.10.4
Interface utilisateur 20251001.4
The energy dashboard only contains about 30 days of data (new install). One CPU is running at 100% when the energy dashboard is loading and CPU usage drops to 0% after data is loaded in the web page.
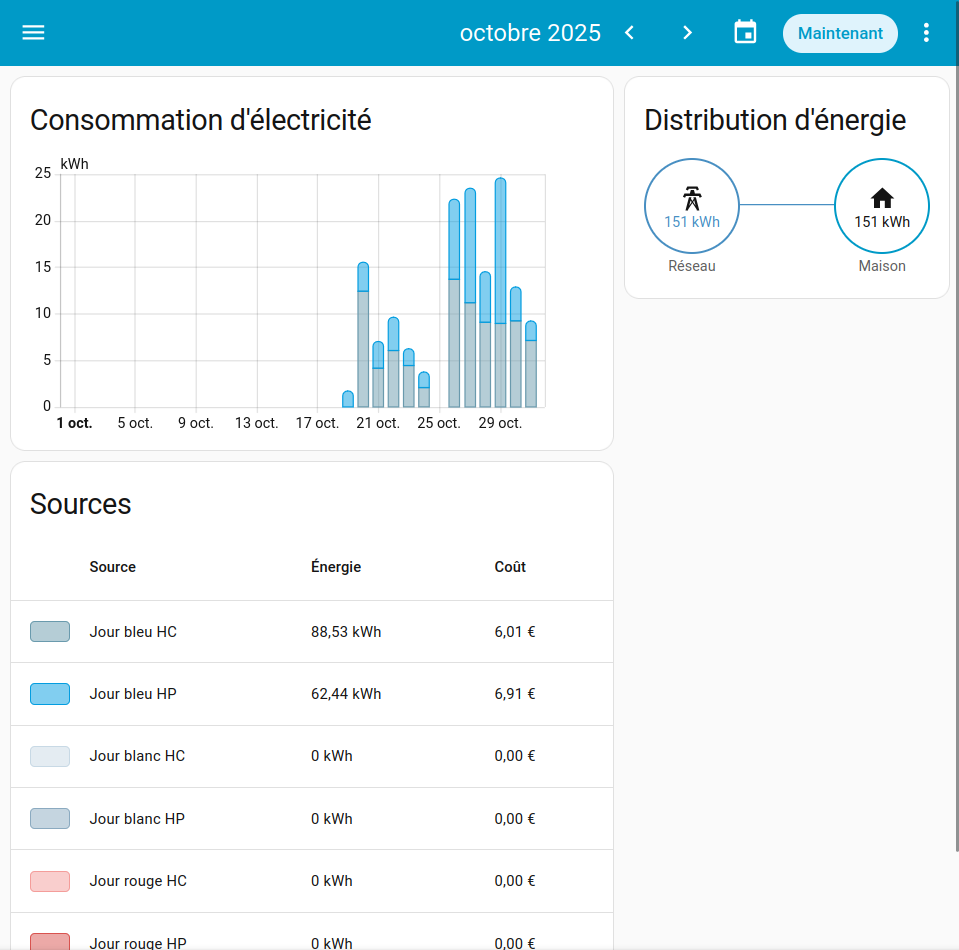
Loads for about 1 minute then shows data as expected:
How much data is it analyzing to display?
Are you recording consumption for each nanosecond, or default settings?
How large is your database?
How much memory does your Pi have?
$ cat configuration.yaml
# Loads default set of integrations. Do not remove.
default_config:

http:
  # For extra security set this to only accept connections on localhost if NGINX is on the same machine
  # Uncommenting this will mean that you can only reach Home Assistant using the proxy, not directly via IP from other clients.
  #  server_host: 172.18.0.1
  use_x_forwarded_for: true
  # You must set the trusted proxy IP address so that Home Assistant will properly accept connections
  # Set this to your NGINX machine IP, or localhost if hosted on the same machine.
  trusted_proxies:
    - 127.0.0.1
    - 172.18.0.1
    - 192.168.1.2

automation: !include automations.yaml
script: !include scripts.yaml
scene: !include scenes.yaml

input_boolean:
  air_heater:
    name: Chauffage air VMC
    icon: mdi:hvac

alarm_control_panel:
  - platform: manual
    code_arm_required: false
    delay_time: 0
    arming_states: armed_away

frontend:
  themes:
    "Energy: Tempo colors":
      modes:
        light:
          energy-grid-consumption-color-0: "#6a9aad"
          energy-grid-consumption-color-1: "#039DE0"
          energy-grid-consumption-color-2: "#C8D9E5"
          energy-grid-consumption-color-3: "#8BAAC0"
          energy-grid-consumption-color-4: "#F49D9A"
          energy-grid-consumption-color-5: "#D9534F"
          energy-grid-consumption-color-6: "#9eb75C"
        dark:
          energy-grid-consumption-color-0: "#9BE1FD"
          energy-grid-consumption-color-1: "#039DE0"
          energy-grid-consumption-color-2: "#C8D9E5"
          energy-grid-consumption-color-3: "#8BAAC0"
          energy-grid-consumption-color-4: "#F49D9A"
          energy-grid-consumption-color-5: "#D9534F"
          energy-grid-consumption-color-6: "#9eb75C"
Here is the top process:
    PID USER      PR  NI    VIRT    RES    SHR S  %CPU  %MEM     TIME+ COMMAND
 131003 root      20   0 1185860 491292 105216 S 100,3   6,0  21:03.86 python3 -m homeassistant --config /config
Next process in the list uses less than 1% of a CPU.
Default energy dashboard view is 1 month but I get the same result for 1 day
Consumption are recorded with the default settings
1 month of data
My Pi has 8 Gb of memory, it’s not a bottleneck here:
$ free -m
               total        used        free      shared  buff/cache   available
Mem:            7937        1120        3628          76        3451        6816
Swap:           1023           0        1023
I’m guessing it does a fresh database query in real time each time your dashboard loads, as well as refreshes, and this takes about a minute as you have observed. Consider how many stored date points are being queried from all of your visible six sources in the display, it is probably about right. Database query optimization may be in your future - see the source code in GitHub for clues