Visibility on hidden power consumption - Energy Dashboard

Currently the energy dashboard allows users to how much power is used and what is provided by solar/ the net.
Furthermore, it also allows users to see individually measured consumption for all energy measuring smart outlets.
What would really make this information more powerfull is the ability to find hidden consumption in your home.
In order to reduce unnecessary power consumption.
To this end a “total individually measured powerconsumption” visualization could be added to the energy dashboard (possibly with an feature toggle to allow users to not use this functionality).

This visualization would sum all of the provided individual energy consumption metrics.
After which it’s subtracts this value from the total house energy consumption.
The visualization could either be a new ring in the energy-distribution card which also respects the energy-date-selection with an outer ring around the house indicating how much of the energy consumption is accounted for.
Otherwise it could be added as another guage card named something like “Hidden power consumption” or “unaccounted power consumption”.
Or perhaps even being displayed as total information in the bar chart presenting the individually measured device consumption values (energy-devices-graph)

Currently i’ve implemented the concept as an guage in my own instance with the following templated sensor config:

- sensor:
      name: total_consumed_daily_energy
      unit_of_measurement: kWh
      state: >
        {% set ns = namespace(states=[]) %}
        {% for s in states.sensor %}
          {% if (s.object_id.startswith('coolcam_') and s.object_id.endswith('total_daily_energy'))  %}
            {% set ns.states = ns.states + [ s.state | float ] %}
          {% endif %}
        {% endfor %}
        {{ ns.states | sum }}
      state_class: measurement

Which is visualized as seen in (the bottom right) this image:

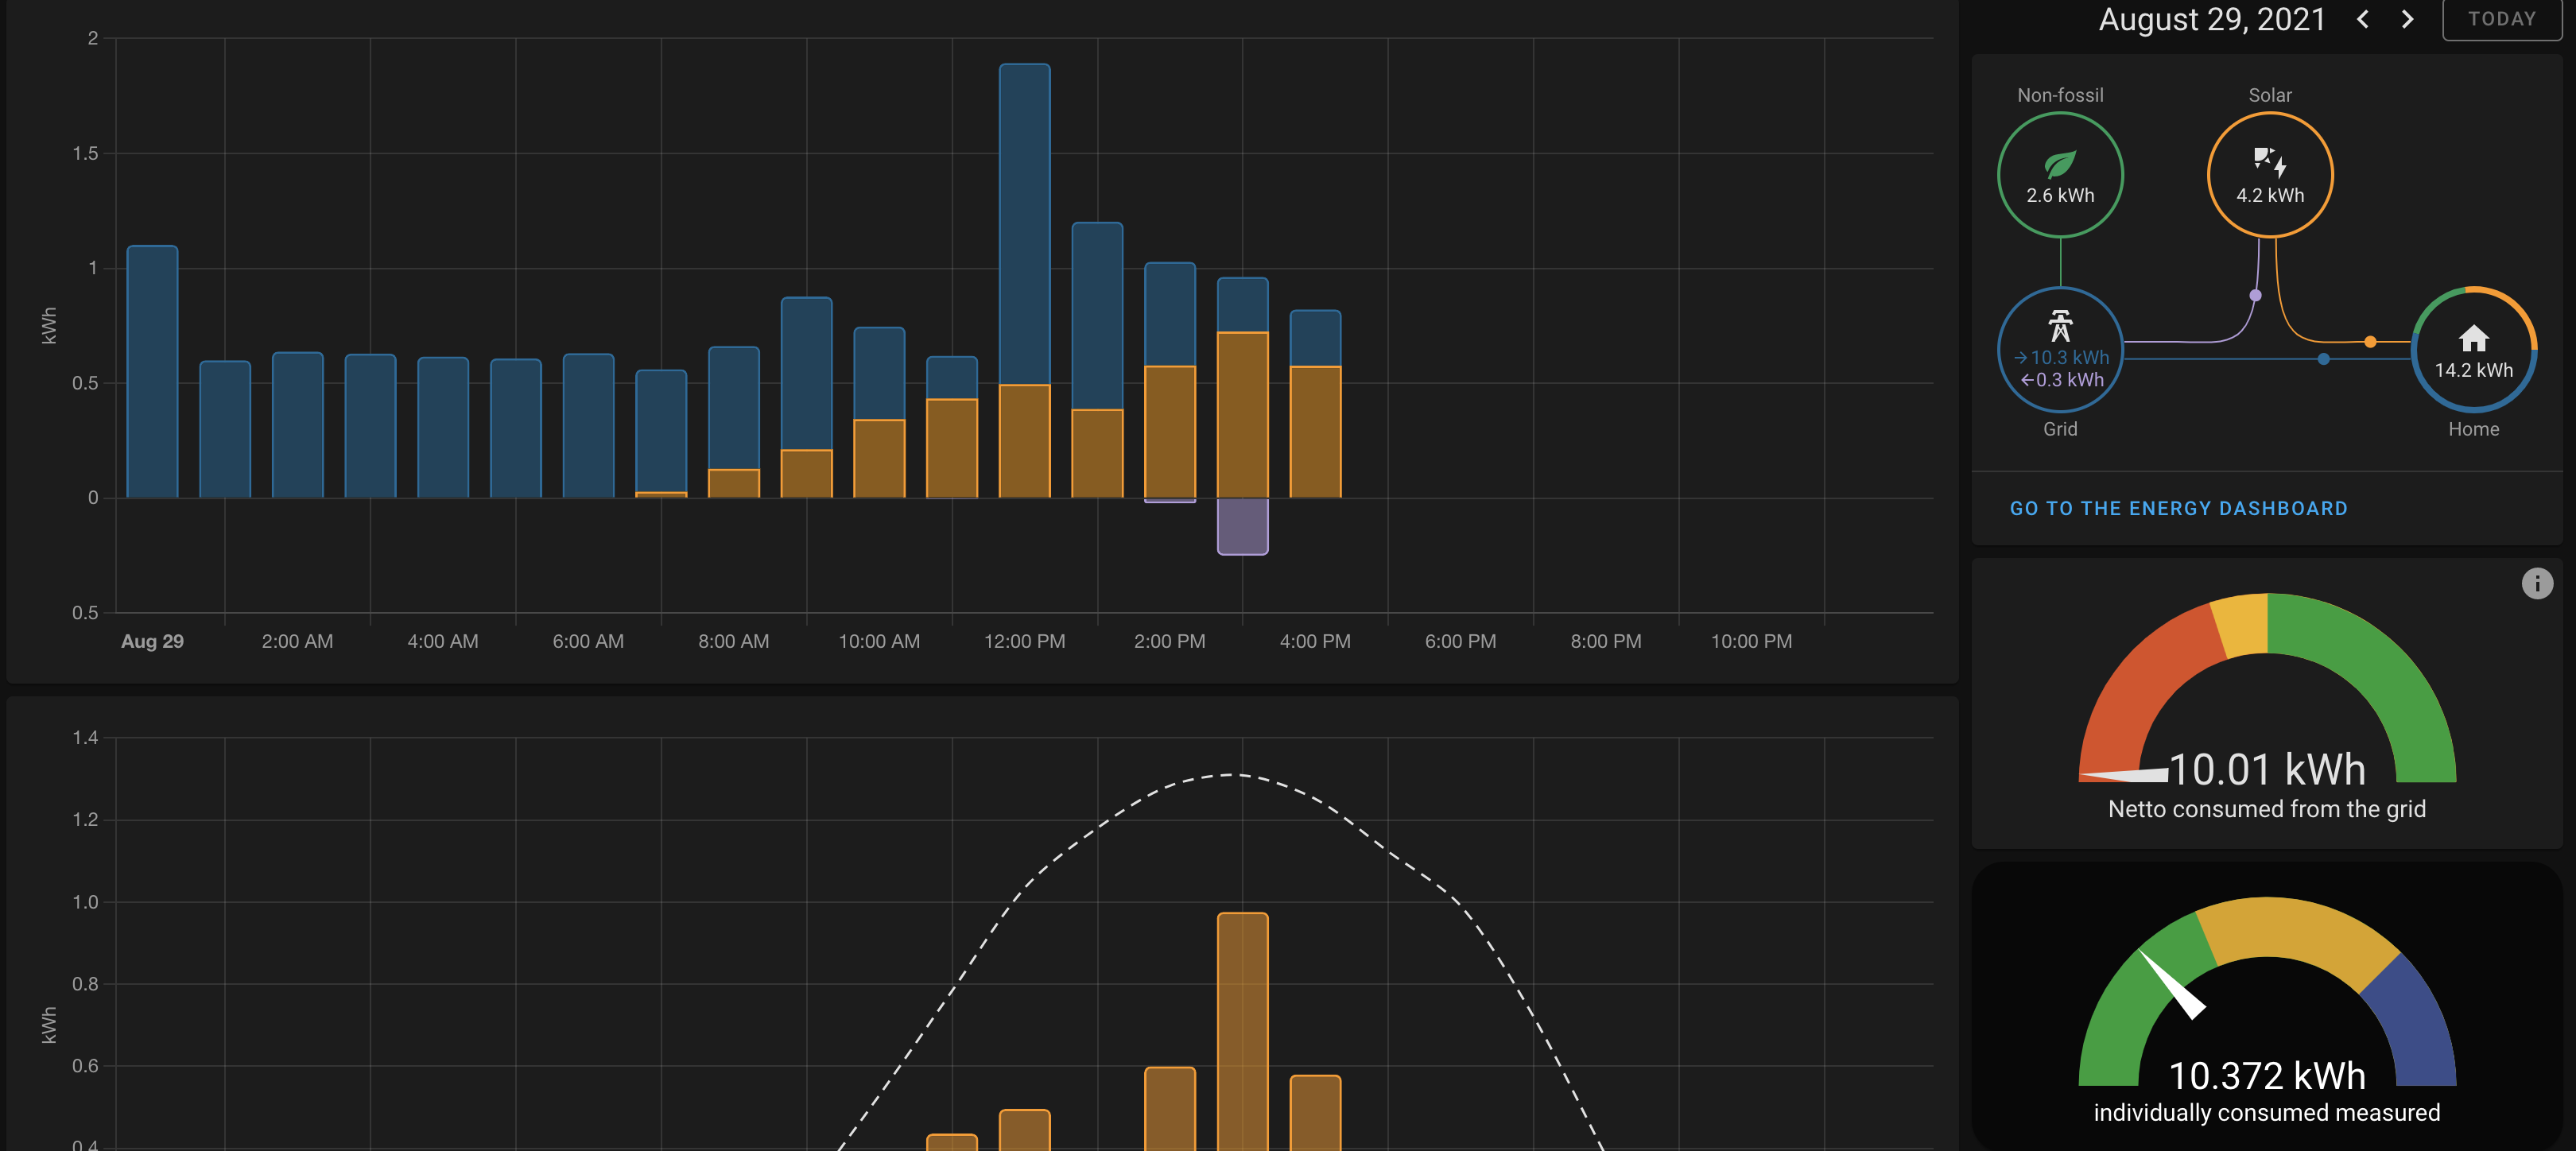
The major downside of this solution is that it’s not aware of the type: energy-date-selection card.
Therefore, only allowing it to be usefull for calculating the current days individual measured energy consumption.

The attached image shows that of the 14.2 KwH consumed only 10.3 KwH is accounted for.
Which would ideally be displayed as there has been 3.9 KwH hidden power comsuption on day X.

Interesting post. I came across this topic as I was trying to do something similar. Initially I wanted to see the current power consumption, which is basically the difference between Solar Production and Returned to Grid. The problem with this is that the Solar is measured in Watt and the Return to Grid is measured in kWh. The current Power Consumption coming from the Smart Meter is not taking into account the number of Watt’s consumed from the current Solar Power.

I am also monitoring the individual devices and like your request to see the total of those individual devices over time (same as date selected on the energy dashboard) since that would allow us to see how much energy is consumed and not individually accounted for, or like you say ‘hidden energy’ consumers.

So new functionality for the Energy Tab I would like to see:

  • Total current Power consumed in Watts (both solar and and non-solar (grid)) This will help to understand how much solar energy is currently used and if there is room for more appliances to switch on without using grid energy. This to maximize the total self consumed Solar energy.

EDIT: This is actually solved by a prior release where you can now change the unit of measurement easily on the entity properties page.

  • Total Energy used for individual appliances/devices & the ‘rest count’ of (hidden) energy not individually measured = total energy consumed (point in time/period)

EDIT: What I have done so far is add up all energy for the devices that measure (mostly Shelly in my situation) and deduct that from the total home energy used (which is a sum of grid consumption, grid production and solar production). I also try to monitor this by looking at the actual power consumption by using the power statistics from the same devices, however this is a a bit unreliable since not all devices measure and output the watts at the same frequency and it is not possible to synchronize so far. example: Envoy Solar provides power production measurements every 15 minutes, the P1 DSMR provides updates every second and my Shelly devices provide power at another different frequency.

I would really love to hear if anyone implemented this in a good way?

I really like the idea!