Not sure if the title is correct but I have a solar system with to lines meaning two sets of panels on both sides of my roof.
I measure the pv energy combined because that should be more precise but I would like to create 2 separate graphs for the individual sides to fine tune the forecast settings for each side.
Is it somehow possible to access the forecast data?
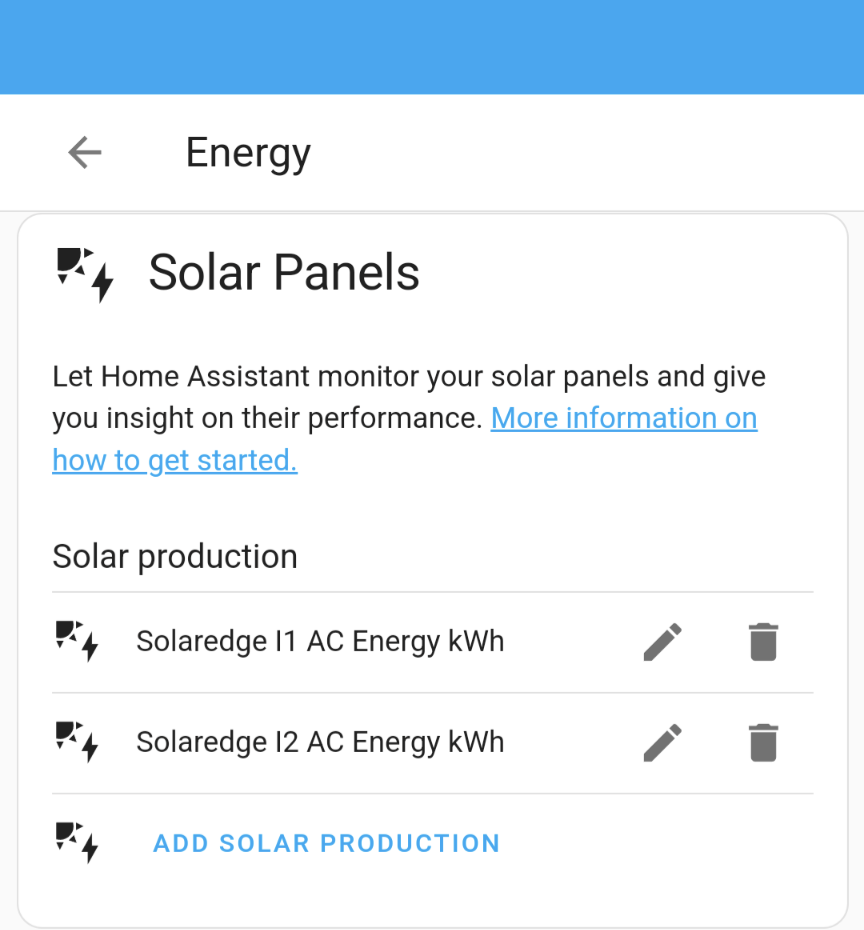
If you have two inverters you can load them as two different solar sources in the energy dashboard, as I have done.

If you have one inverter and two strings it is generally not possible to show the seperation.
I have one inverter with two strings but I can get the values of the strings separately. The problem is that this might result in too high overall values because of missing transformation losses.
I would just like to see the string graphs compared to the two separate forecast graphs on my custom dashboard
For calculations in the energy dashboard the total is ok.