martinst
November 19, 2021, 9:58am
1
I have created a history_stats sensor and one for the formatting.
This works good. But I wanted to show in the frontend each day seperate.
So today, yesterday, today - 2 , today -3, etc…
So I can copy paste this code, but it will be enormous amounts of code. Could this be more efficient?
  - platform: history_stats
    name: "masterbedroom_raam_open_gisteren_stats"
    entity_id: sensor.masterbedroom_raam_status
    state: "open"
    type: time
    end: "{{ now().replace(hour=0, minute=0, second=0) }}"
    duration:
      hours: 24

  - platform: template
    sensors:
      masterbedroom_raam_open_gisteren_stats_formatted:
        value_template: "{% set hours = states('sensor.masterbedroom_raam_open_gisteren_stats') | float %}
          {% set minutes = ((hours % 1) * 60) | int %}
          {{ '%02ih %02im'%(hours // 1, minutes) }}"
        friendly_name: Masterbedroom raam open (gisteren)
        unique_id: "masterbedroom_raam_open_gisteren_stats_formatted"
        icon_template: mdi:chart-line


  - platform: history_stats
    name: "masterbedroom_raam_open_vandaag_stats"
    entity_id: sensor.masterbedroom_raam_status
    state: "open"
    type: time
    start: "{{ now().replace(hour=0, minute=0, second=0) }}"
    end: "{{ now() }}"

  - platform: template
    sensors:
      masterbedroom_raam_open_vandaag_stats_formatted:
        value_template: "{% set hours = states('sensor.masterbedroom_raam_open_vandaag_stats') | float %}
          {% set minutes = ((hours % 1) * 60) | int %}
          {{ '%02ih %02im'%(hours // 1, minutes) }}"
        friendly_name: Masterbedroom raam open (vandaag)
        unique_id: "masterbedroom_raam_open_vandaag_stats_formatted"
        icon_template: mdi:chart-line
nilux
November 19, 2021, 10:16am
2
Maybe just use statistics card
tom_l
November 19, 2021, 10:17am
3
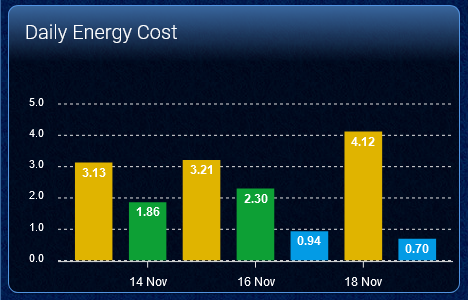
You don’t need a sensor for each day. Just graph that one for a week with the mini graph card or apexcharts.
e.g. This is one sensor:
type: custom:apexcharts-card
apex_config:
  chart:
    height: 140%
  dataLabels:
    background:
      enabled: false
    style:
      colors:
        - var(--primary-text-color)
graph_span: 1w
span:
  end: day
header:
  show: true
  title: Daily Energy Cost
experimental:
  color_threshold: true
yaxis:
  - id: left
    min: ~0
    apex_config:
      forceNiceScale: true
series:
  - entity: sensor.total_cost_today
    type: column
    yaxis_id: left
    float_precision: 2
    show:
      datalabels: true
    group_by:
      func: last
      duration: 1d
    color_threshold:
      - color: '#e45e65'
        value: 4.5
      - color: '#e0b400'
        value: 3
      - color: '#0da035'
        value: 1.5
      - color: '#039BE5'
        value: 0
card_mod:
  class: top-level-chart
2 Likes
martinst
November 19, 2021, 11:36am
4
Yes that is better way to do.
The history_stats sensors for each day are ofcourse only necessary if want to control something depending on that value.
But the sensor I want to monitor is if a window is open or closed and how long that was.
So it is binary sensor.
So I have used your piece of script for the apexcharts and changed the sensor to my binary_sensor. But it doesn’t show any data.
Is there something special necessary for binary sensors?
tom_l
November 19, 2021, 12:53pm
5
Graph your history stats sensor, not the binary sensor. That will show you how long the window has been open on each day of the week.
martinst
November 19, 2021, 12:59pm
6
Okay but that means that I have to create 1 history_stats sensor with a duration of 7 days? And then the chart can split that data to seperate days?
tom_l
November 19, 2021, 1:02pm
7
No, you use your existing history stats sensor that measures how long the window is open during a day.
Home Assistant recorder (history) will keep that daily total of each day for the default recorder purge interval of 10 days (unless you have changed this). So you can graph the daily total each day for up to ten days.
You can graph any sensor for up to 10 days unless you have excluded it from the recorder.
martinst
November 19, 2021, 1:19pm
8
Okay it becomes clear to me:
So I have now this sensors:
binary_sensor:
  - platform: template
    sensors:
      masterbedroom_window:
        value_template: "{{ not is_state('sensor.masterbedroom_raam_status', 'closed') }}"
        friendly_name: 'Masterbedroom raam'
        device_class: window
        entity_id: sensor.masterbedroom_raam_status


  - platform: history_stats
    name: "masterbedroom_raam_open_vandaag_stats"
    entity_id: sensor.masterbedroom_raam_status
    state: "open"
    type: time
    start: "{{ now().replace(hour=0, minute=0, second=0) }}"
    end: "{{ now() }}"
I have NOT excluded those sensors from the recorder (and my recorder has indeed 10 days).
I have created the graph like your example:
type: custom:apexcharts-card
apex_config:
  chart:
    height: 140%
  dataLabels:
    background:
      enabled: false
    style:
      colors:
        - var(--primary-text-color)
graph_span: 1w
span:
  end: day
header:
  show: true
  title: Time window is open
experimental:
  color_threshold: true
yaxis:
  - id: left
    min: ~0
    apex_config:
      forceNiceScale: true
series:
  - entity: sensor.masterbedroom_raam_open_vandaag_stats
    type: column
    yaxis_id: left
    float_precision: 2
    show:
      datalabels: true
    group_by:
      func: last
      duration: 1d
    color_threshold:
      - color: '#e45e65'
        value: 4.5
      - color: '#e0b400'
        value: 3
      - color: '#0da035'
        value: 1.5
      - color: '#039BE5'
        value: 0
card_mod:
  class: top-level-chart
I only see 1 day in the graph (and I have to change the format to hours/minutes).
But in the HA history I also see only today’s data. The sensor I have running for a several days. Maybe I have renamed it yesterday but I don’t think that.
But what I have now that is correct? So tomorow it should show data for more days?
tom_l
November 19, 2021, 1:27pm
9
Yes, it looks to be correct.
One way to check is to use history page in the left hand menu. How many days does it show data for that sensor?
tom_l
November 19, 2021, 1:32pm
10
Hang on…
This is not a binary sensor:
  - platform: history_stats
    name: "masterbedroom_raam_open_vandaag_stats"
    entity_id: sensor.masterbedroom_raam_status # <-------This is a sensor not a binary sensor.
Just use your binary sensor that monitors the window, for how long the state is 'on'.
martinst
November 19, 2021, 1:36pm
11
Damn…I see it…I have made a typo.
I will change it thanks!
tom_l
November 19, 2021, 1:39pm
12
Keep in mind that even though your binary sensor displays Open in Lovelace, its state is actually 'on' and that is what you will have to use in the history stats.
state: "on"
martinst
November 19, 2021, 1:55pm
13
Okay I have to explain something:
The window reed contact is connect to an ESP controller. That is exposed as an MQTT sensor:
  - platform: mqtt
    unique_id: "masterbedroom_esp8266_controller"
    name: "Masterbedroom raam status"
    state_topic: "Huis\\MasterBedroom\\RaamStatus"
    expire_after: 10
    qos: 0
    value_template: "{{ value_json.status }}"
The value of this MQTT sensor could be:
So I have also created a binary sensor to combine open and ventilatie (English: ventilation).
And I have the history stats sensor based on the MQTT sensor.
So I think it is correct. In the history_stats sensor you see: state: “open”
binary_sensor:
  - platform: template
    sensors:
      masterbedroom_window:
        value_template: "{{ not is_state('sensor.masterbedroom_raam_status', 'closed') }}"
        friendly_name: 'Masterbedroom raam'
        device_class: window
        entity_id: sensor.masterbedroom_raam_status


  - platform: history_stats
    name: "masterbedroom_raam_open_vandaag_stats"
    entity_id: sensor.masterbedroom_raam_status
    state: "open"
    type: time
    start: "{{ now().replace(hour=0, minute=0, second=0) }}"
    end: "{{ now() }}"
So I don’t use the binary sensor at the moment for the history_stats sensor.
But for sure…i have to make clearer names for all the sensors.
tom_l
November 19, 2021, 2:04pm
14
Ah ok. Yeah that should work.
What is the difference between open and ventilate?
Did you check the history page to see how far back you have recorded data for the history stats sensor?
Also you should remove this line from your template binary sensor:
binary_sensor:
  - platform: template
    sensors:
      masterbedroom_window:
        value_template: "{{ not is_state('sensor.masterbedroom_raam_status', 'closed') }}"
        friendly_name: 'Masterbedroom raam'
        device_class: window
        entity_id: sensor.masterbedroom_raam_status ### <--- remove this line ###
Specifying an entity to monitor was depreciated quite a few versions ago (v0.115). It’s probably generating errors or warnings in your log. You should check and update your other template binary sensors and template sensors too.
martinst
November 19, 2021, 2:37pm
15
I have connected 2 reed sensors to my window (I have to paint the window, so that is the reason why the cables are still visible)
The reason for this is that I have a cover at the ouside. So I have made a safety system that the cover is only allowed to go down when the window is on ventilation state (so the upper reed sensors) or closed (the lower reed sensors). When the window is open, I get a push notification that the cover could not be closed.
So with those sensor I could detect if the window is: OPEN / CLOSED or VENTILATION.
I have check the history of others stats sensors and they have data (more then 1 day). So I will wait till tomorrow and see if everything is correct.
Thanks for the tip I will update my sensors and remove the entity_id lines.
Another question about the y axis. Do you know how to change that format. It is now a numeric scale and it should be hours/minutes?
tom_l
November 19, 2021, 2:43pm
16
I’m not sure you can. You would have to pick hours or minutes. But you could ask here:
Hi folks,
I’ve built a new card to display some graphs in Lovelace ApexChartsJS , and you’ll find all kind of examples of what you could build over here
[Image]
here
beta/dev releases documentation ca…
Creatish
May 2, 2022, 9:02am
17
Thankyou, Just been doing the same and this makes sense
Can now create a sensor for 1 day and 1 Week, then I have graphs showing days and weeks
power of forums helping people 1 year on
berkans
June 12, 2022, 1:44pm
18
have you maneged to convert the graph data to hours and minutes ?
martinst
June 13, 2022, 5:14pm
19
Yes, but it is still not perfect
It shows also milliseconds and I don’t want that.
type: custom:apexcharts-card
apex_config:
  chart:
    height: 140%
  dataLabels:
    background:
      enabled: false
    style:
      colors:
        - var(--primary-text-color)
graph_span: 1w
span:
  end: day
header:
  show: true
  title: Masterbedroom raam status
experimental:
  color_threshold: true
yaxis:
  - id: left
    min: ~0
    apex_config:
      forceNiceScale: true
series:
  - entity: sensor.masterbedroom_raam_open_vandaag_stats
    type: column
    name: Open
    yaxis_id: left
    float_precision: 2
    show:
      datalabels: false
      as_duration: hour
    group_by:
      func: last
      duration: 1d
  - entity: sensor.masterbedroom_raam_gesloten_vandaag_stats
    type: column
    name: Gesloten
    yaxis_id: left
    float_precision: 2
    show:
      datalabels: false
      as_duration: hour
    group_by:
      func: last
      duration: 1d
  - entity: sensor.masterbedroom_raam_ventilatie_vandaag_stats
    type: column
    name: Ventilatie
    yaxis_id: left
    float_precision: 2
    show:
      datalabels: false
      as_duration: hour
    group_by:
      func: last
      duration: 1d
card_mod:
  class: top-level-chart