The energy dashboard is great for tracking energy consumption over time (kWh), but I’d love to see a dashboard dedicated to real-time power usage (kW). This would allow me to instantly monitor how much power I’m using and identify which devices are consuming the most at any given moment.
For example, in Belgium, we now have a capaciteitstarief, where electricity bills are partly based on peak consumption. A live power dashboard would make it easier to spot and manage these peaks, helping users avoid unnecessary costs. Beyond that, it’s also useful for optimising solar power usage by quickly identifying and turning off high-power devices when needed.
Currently, I can get a similar view using the Sankey Chart custom card, but it requires manual setup. A built-in solution would make this much simpler and more accessible for everyone.
Sidenote: to ‘predict’ my peak consumption (measured over a 15-minute period), I currently calculate it by adding my current peak power usage with the current power usage multiplied by the remaining minutes in the quarter-hour. This allows me to send me a notification when I’m doing a lot of things at the same time (laundry, ironing , dishwasher…) and forgot about this.
Sankey card is very good for that but manual setup could be quite time consuming and it would also be much better if it keeps itself up to date automatically.
With any kind of power usage I’d also like to see it in all different levels like total - each line/phase - breaker - socket - appliance. The easiest way to build such tree would to have “parent” for every power measurement device/entity.
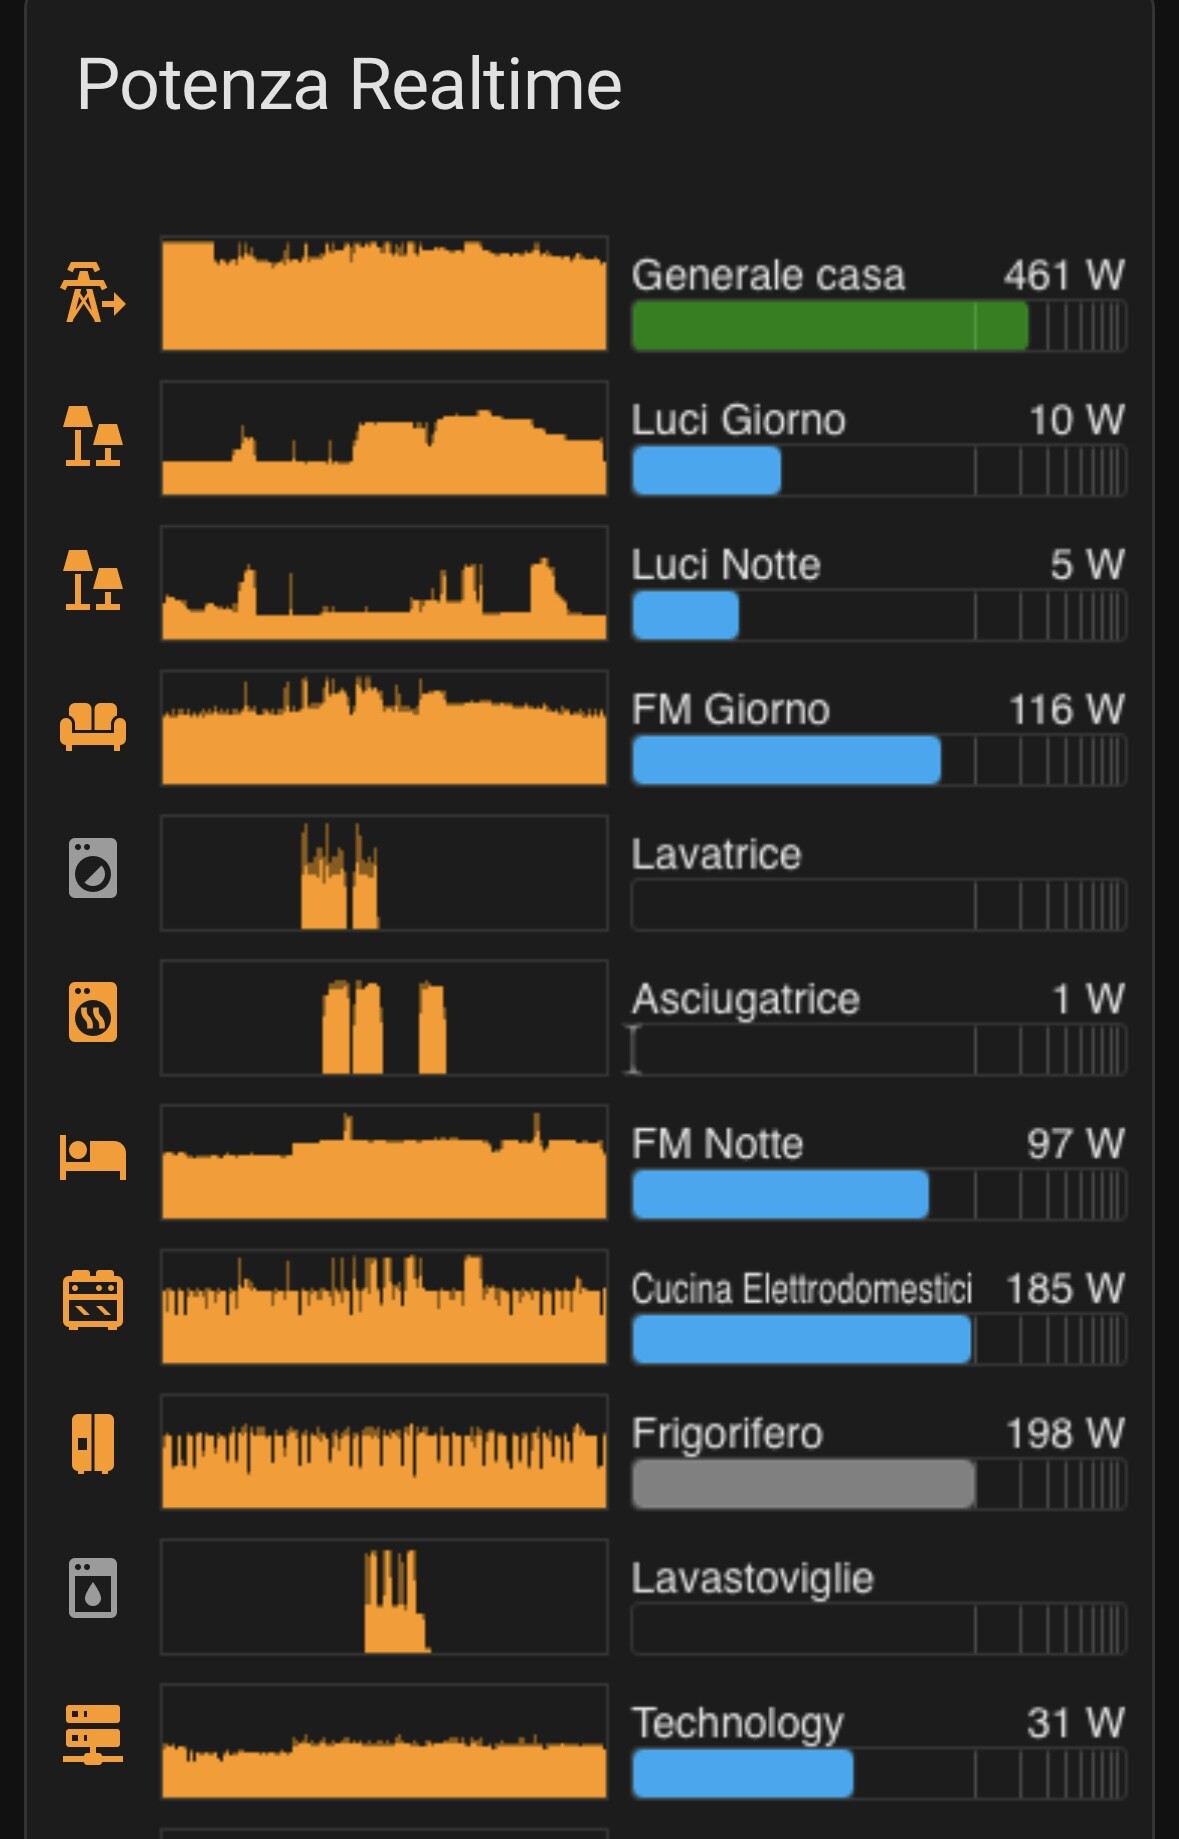
I’ve setup my own dashboard and used a bunch of mushrooms in concert with the sections layout.
Each has a configurable action set depending on the device (lights turn on an off, laptops sleep, or I hold to get a graph for each). If a device is off or in standby, it’s gray. Otherwise it’s coded to a specific color for each device type. A bit of a pain to setup the first time, but once I have the template it’s a breeze.
I fully agree with the earlier decision for an energy dashboard showing the total amount of consumed power, gas and water. It provides the best basis to understand and manage cost.
Many users use Home Assistant as an EMS (Energy Management System) and unlike what the name suggests, it manages power (not energy). A power management dashboard could form the foundation for optimizing solar consumption, load balancing and home battery management.
Power management is more complicated than most people realize, but I hope Home Assistant can begin with making incremental steps towards becoming the open source EMS.
I am a very efficient user of solar power (some 95% of our daily consumption is self-consumption of solar), but I’ve had no need for the energy dashboard. It’s an ‘after the fact’ thing, which is a little nice to know but doesn’t help with power decisions in real time.
I do use the power flow card (and quite a few automations), but would be much handier using an official ‘power dashboard’.
I’ve also created this dashboard manually, but it annoys me that I can’t put it in the same “Energy” section of the UI. I have a few dashboards which I’ve had to put in a “Utilities” section instead.
It would be great if we could “take control” of the energy dashbaord similar to the maps dashboard.
This is how my manually configured sankey charts look like. This example shows total daily usage. The upper row shows different tariffs, then three phases (important in live amperage view to make sure that no line gets overloaded), then all distribution box breakers and finally end devices directly or through sockets with energy measurement.
I have similar live view showing current power and amperage readings, price and so one. All of them need a lot of manual work to set up.
This would be so much easier if I could configure “parent” like I can configure area for each device and use this information everywhere.
I’d like to emphasize that this request is (or shouldn’t be) not about having a fancy dashboard. It needs to solve an actual real-life problem to be worth all the development work.
Why do we need power monitoring in addition to the existing energy monitoring?
Why do we need this to be a core componenten of home assistant and not just a card on a dashboard?
EV smart charging
Basically, all these use cases comes down to an energy management system (EMS). Unlike the name suggests, an EMS manages power, so maybe we should call it an PMS.
Looking at existing EMS/PMS solutions, a.few basic types can de distinguished:
basic PMS: By looking at the current power production and consumption, certain devices can be enabled, paused or disabled.
advanced PMS/EMS: By looking at the current and future (predicted) production and consumption, a plan is made to meet supply and demand optimally.
Having a dashboard which helps users getting insight in the historical power use is an important first step toward better power management. I’d like to note that an overview of the current power use is fun, but not very useful in the grand scheme of things.
Power measuring is not easy. Each device will update at different times. Central logic can help a lot for it to make sense and avoid off results due to delayed updates. Having a dashboard which understands grid, solar, battery and individual devices consistant with the energy dashboard has will provide a better overview of the power use.
It would be awesome to be able to do some forecasting and planning of energy use based on historical data and existing services such as the solar forecast and dynamic energy tariffs.
Battery management and EV charging would be a good use cases to start with since they have a predictable demand and can have adjustable charging capacity.
I’d love to see the design proposal for the energy dashboard or similar functionality so we can work on a good proposal for power management. Can someone point us in the right direction?
@AJedilAm I agree with you. This is more than just a dashboard. In fact a Power EMS is something I’ve been working on for some time for the reasons you’ve given, but what I have is only experimental so far.
For visualisations I suggest you try this card for live power monitoring:
You might also consider EMHASS which might not be quite what you want, but certainly related.
Dave
P.S. I think PMS is an unfortunate acronym collision (at least in UK) so probably worth avoiding that!
There are many examples of partial integration, mostly to show power consumption on the dashboard. Having a dashboard nice start but building EMS functionality on top of it is a lot of work which very few people have the time and skills to do right.
It shows there is a general “need” for a core integratie with more consistency and functionality to build upon.
The energy dashboard now supports adding Power sensors which are then shown in their own tab.
It’s still missing a few things like a flow card but it’s a good start!
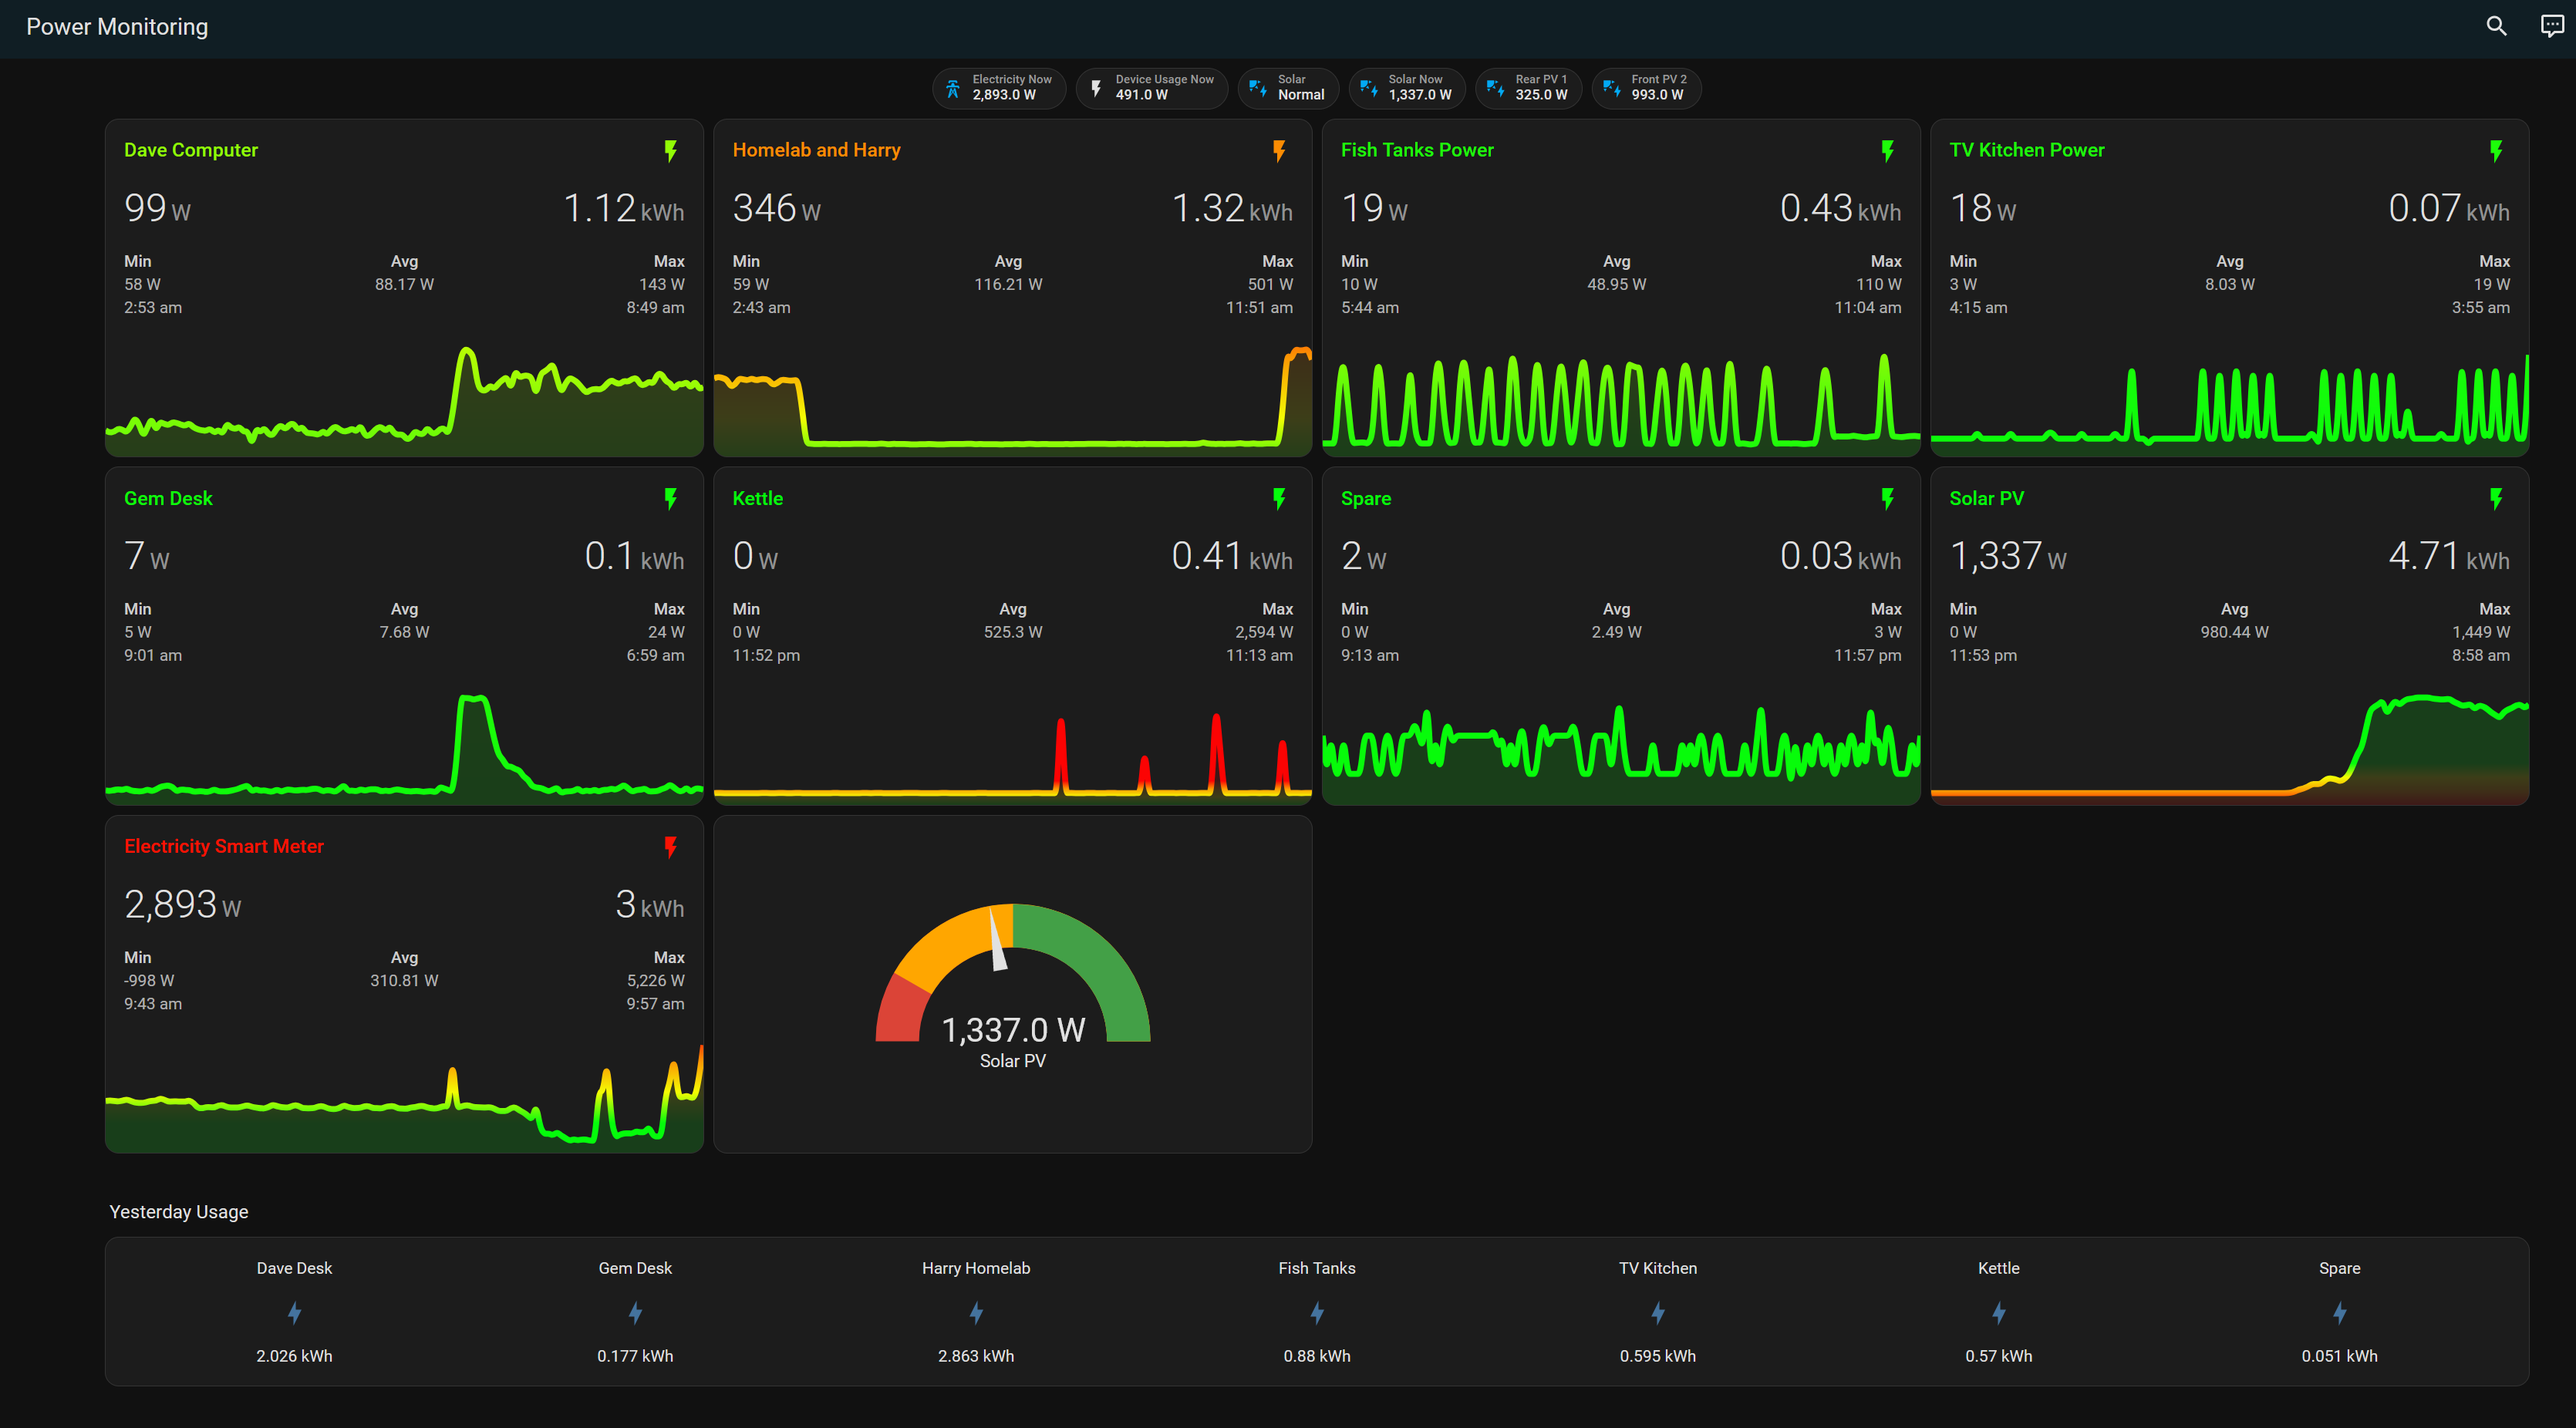
Here is my yaml - you need to add/install the custom card “mini-graph-card”
the badges at the top for Power and Device usage now are using simple helpers to create the grouped usage or subtract/add solar power to the house meter.