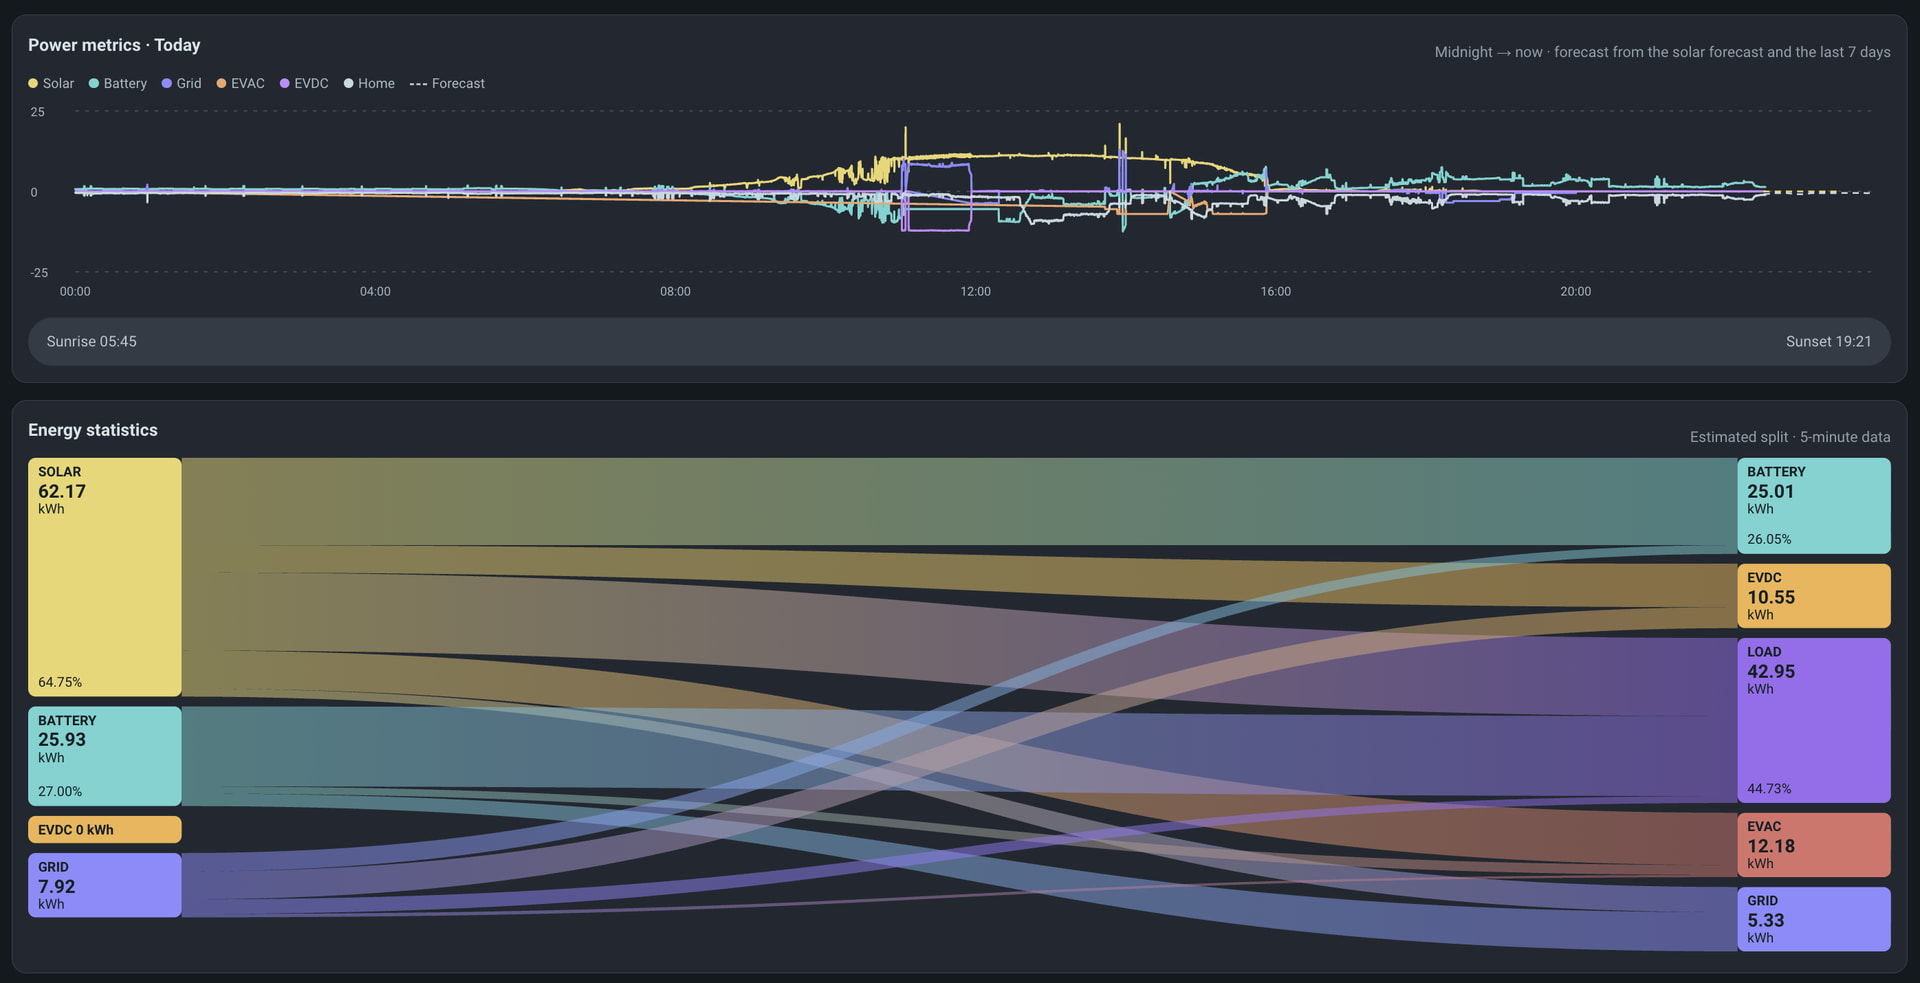
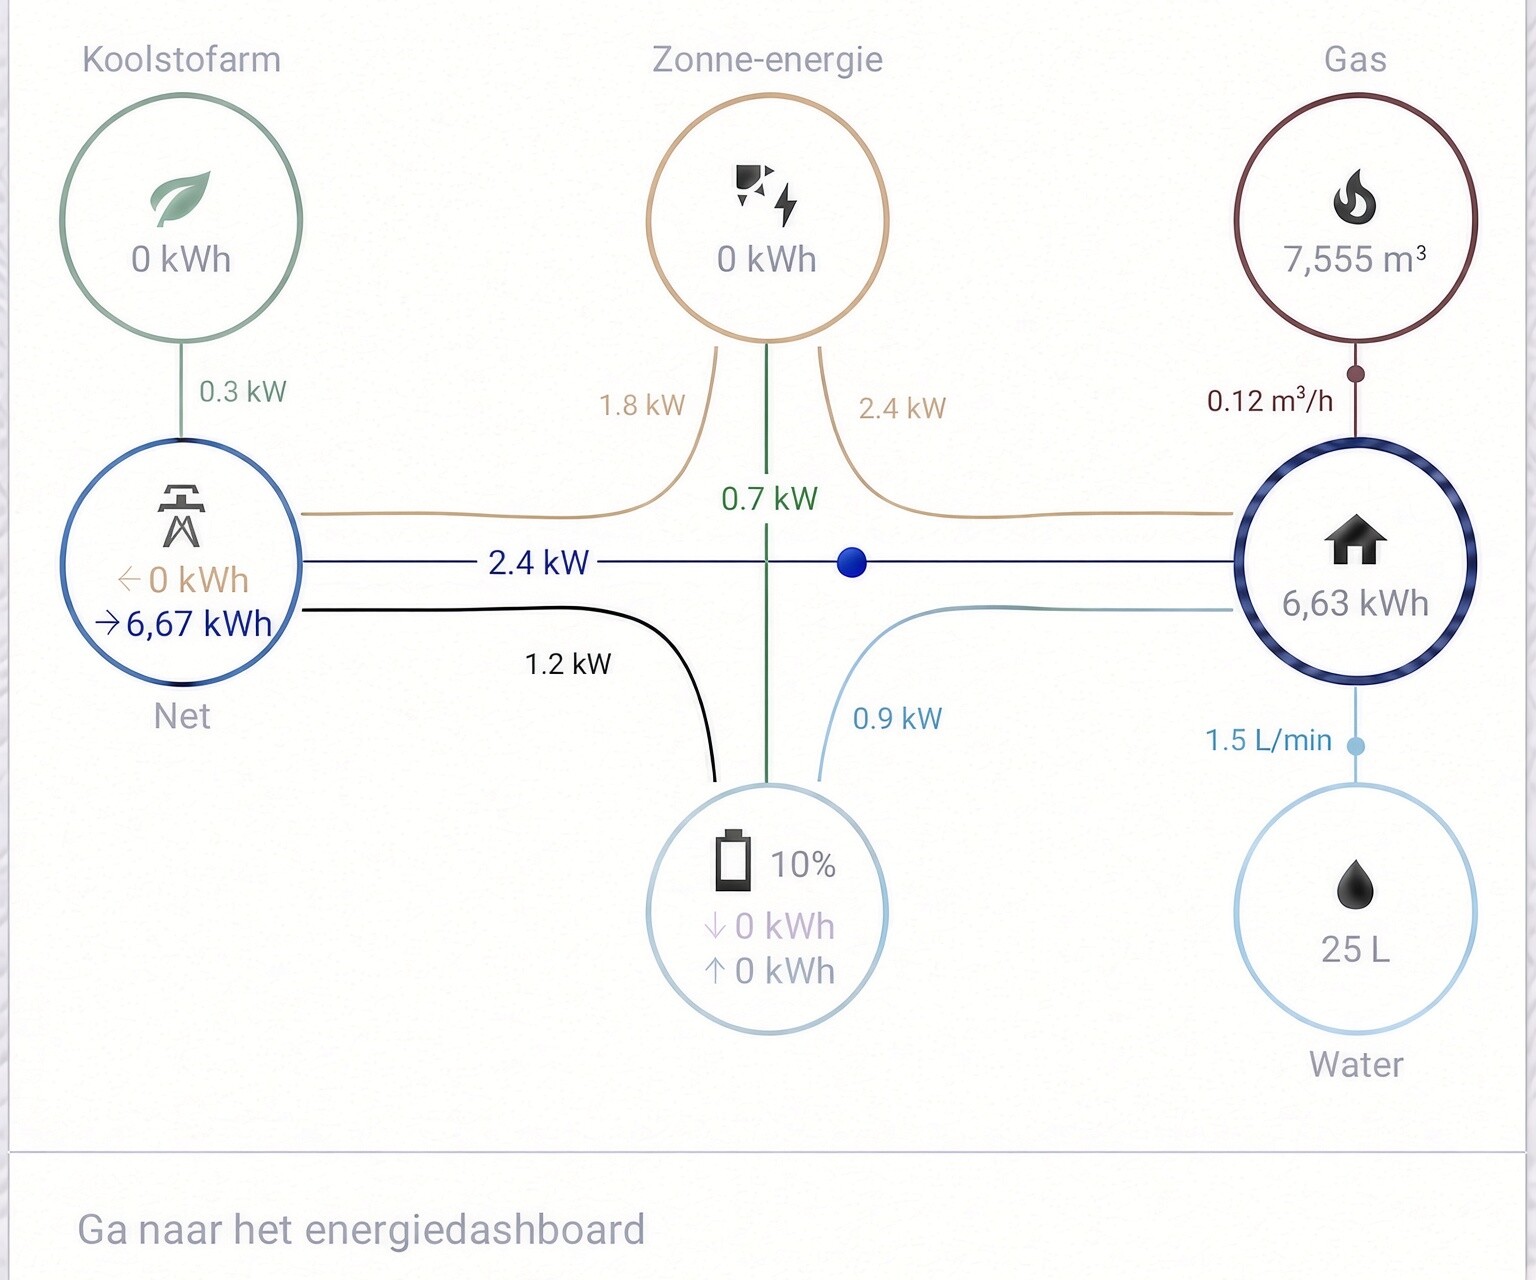
we desperately need a core Power flow diagram
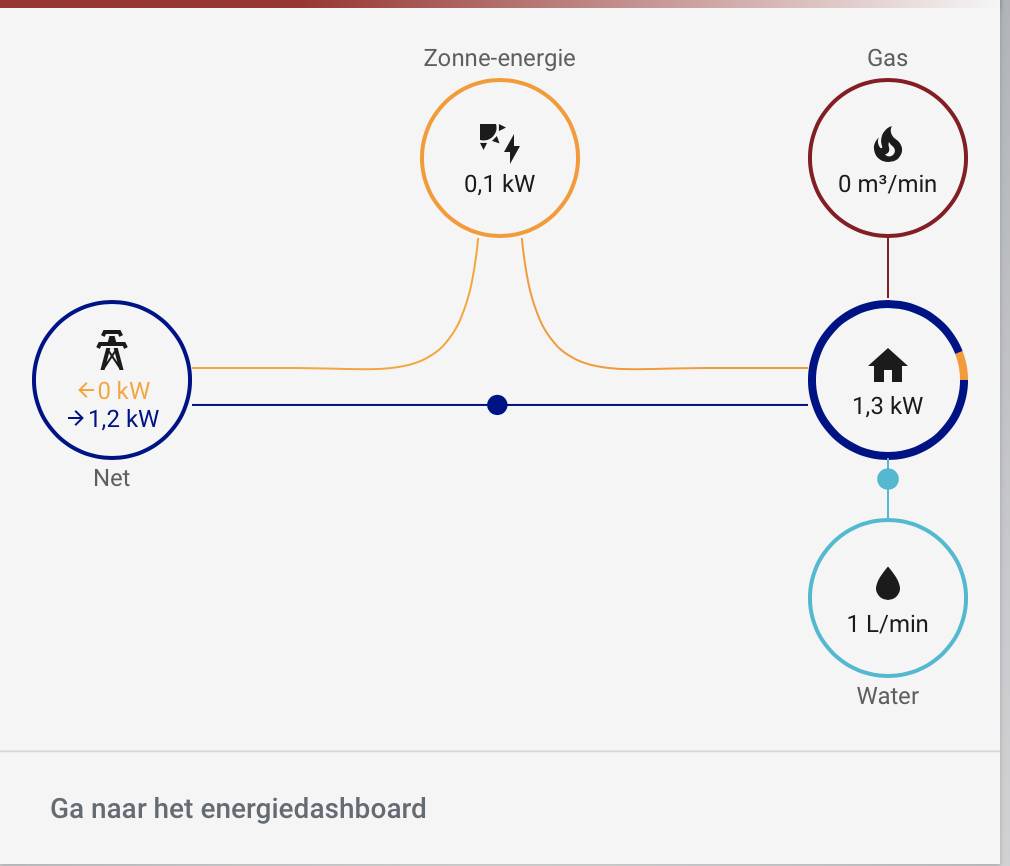
like we have the energy flow:
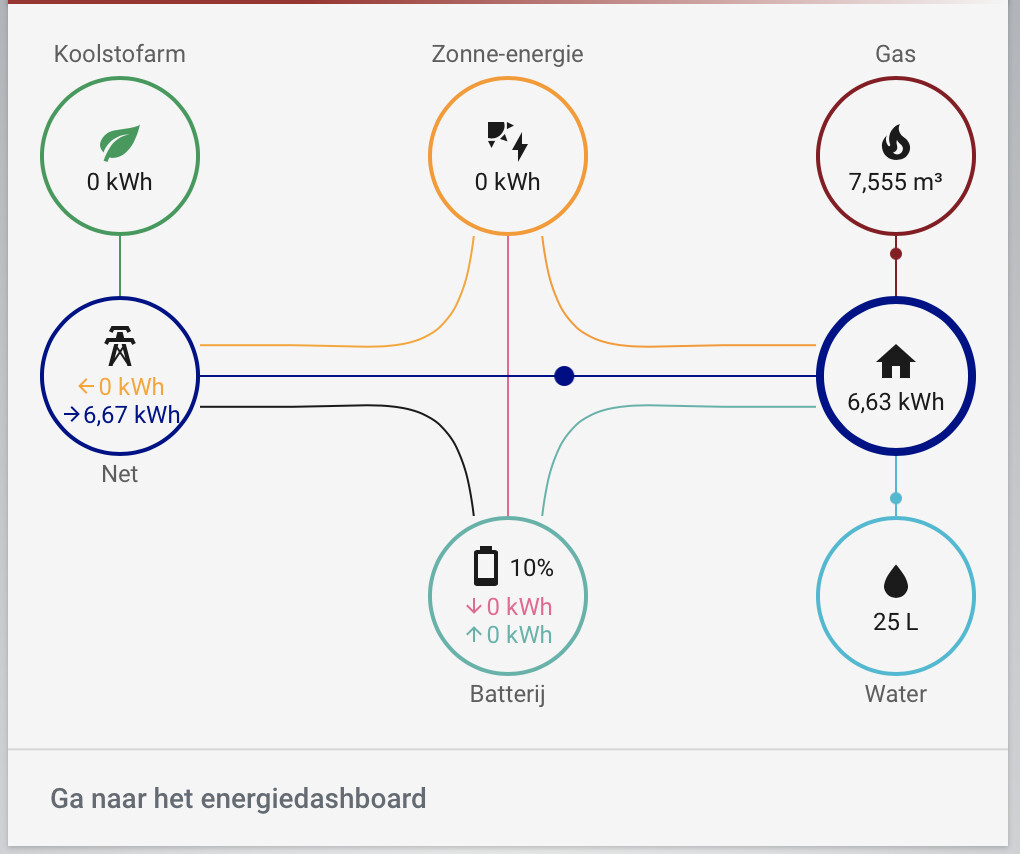
above Power flow diagram is made with custom cards, would be so nice to finally have that under maintenance in core.
we desperately need a core Power flow diagram
like we have the energy flow:
above Power flow diagram is made with custom cards, would be so nice to finally have that under maintenance in core.
We haven’t added it because it would be very confusing for users. They already struggle with power vs energy.
The distribution card is generally better suited to show power (at least on the lines) but it was used for energy and now we are stuck with it.
Honestly, if it was up to me I would remove it entirely and create a better looking version for power. Or better yet for power and energy in one card but that can’t work with the current separation (which is different than what I was going for and was done again because of the confusion between the two).
While I understand the reasoning it just doesn’t make sense to me.
The power-flow is something in the moment where you can act on, the energy flow is a long time (day - year) result which doesn’t tell you much in that respect. If your total power is 2999W
It’s a shame we are hold back because of ‘confused users’, time for education and some blogs.
Happily using custom:power-flow-card-plus
Count me on the other side where I’m confused that we do NOT.
Power!=energy and by not having the power side you’re just contributing to more confusion by reinforcing it’s one thing.
Dont limit something because your student doesn’t understand it now. TEACH them to be better
Yeah well, if development of HA is held back because of users not knowing the difference between power and energy….
Sorry but that just can’t be true.
How would we ever educate those users without that card. Especially since it is dead easy to understand with the actual flow going on!
Of course if there are viable alternatives that show both power and energy flows, don’t hold back . I am all for it
I was merely asking for the obvious here which seems an easy addition
Please don’t make this more complex than it really is
This is like a manufacturer giving a car an odometer but no speedometer because the car manufacturer thinks people are confused by the concept of speed vs distance.
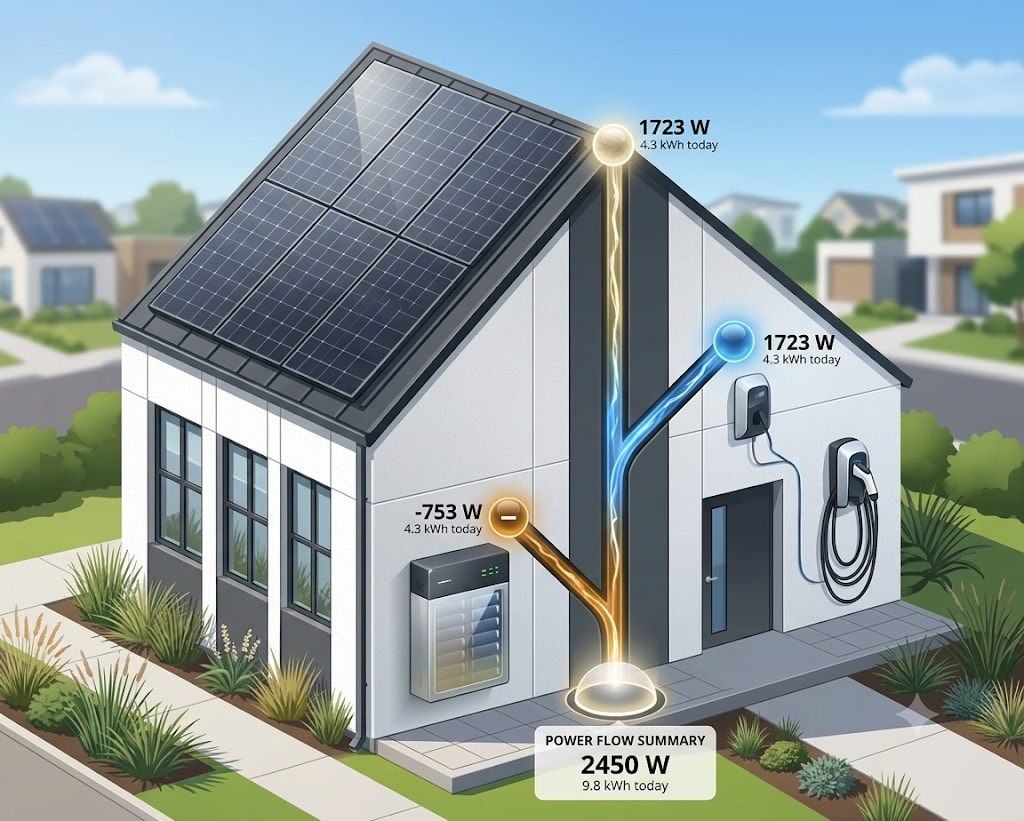
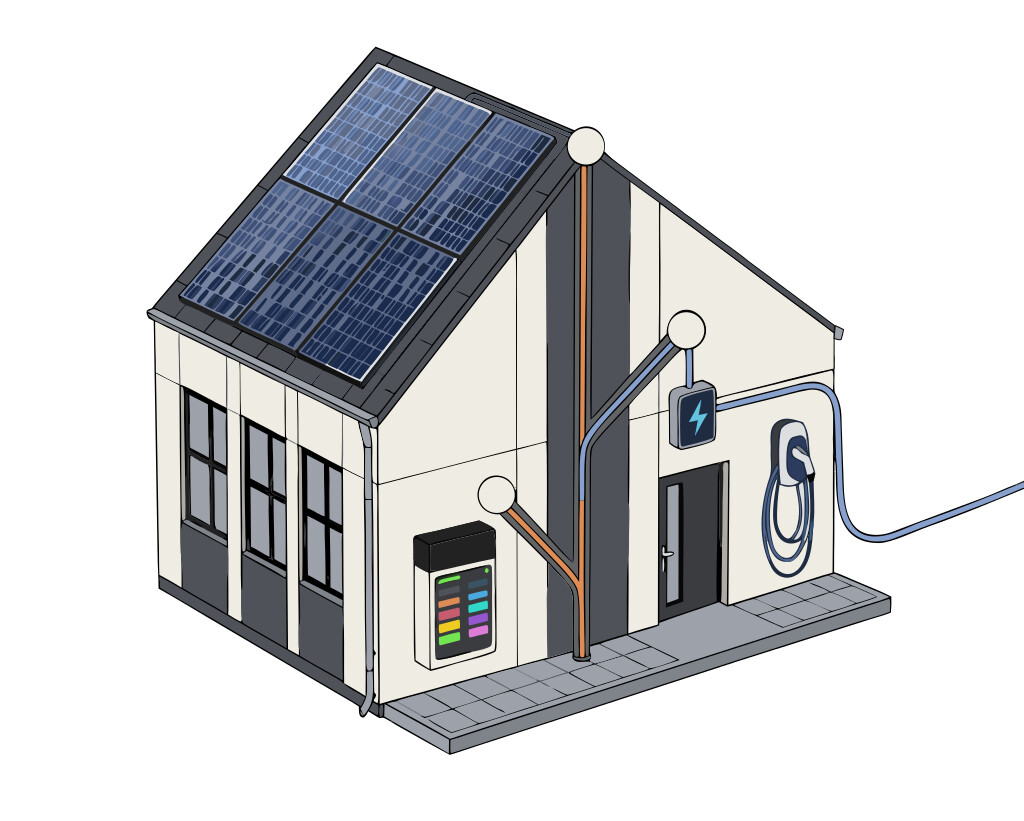
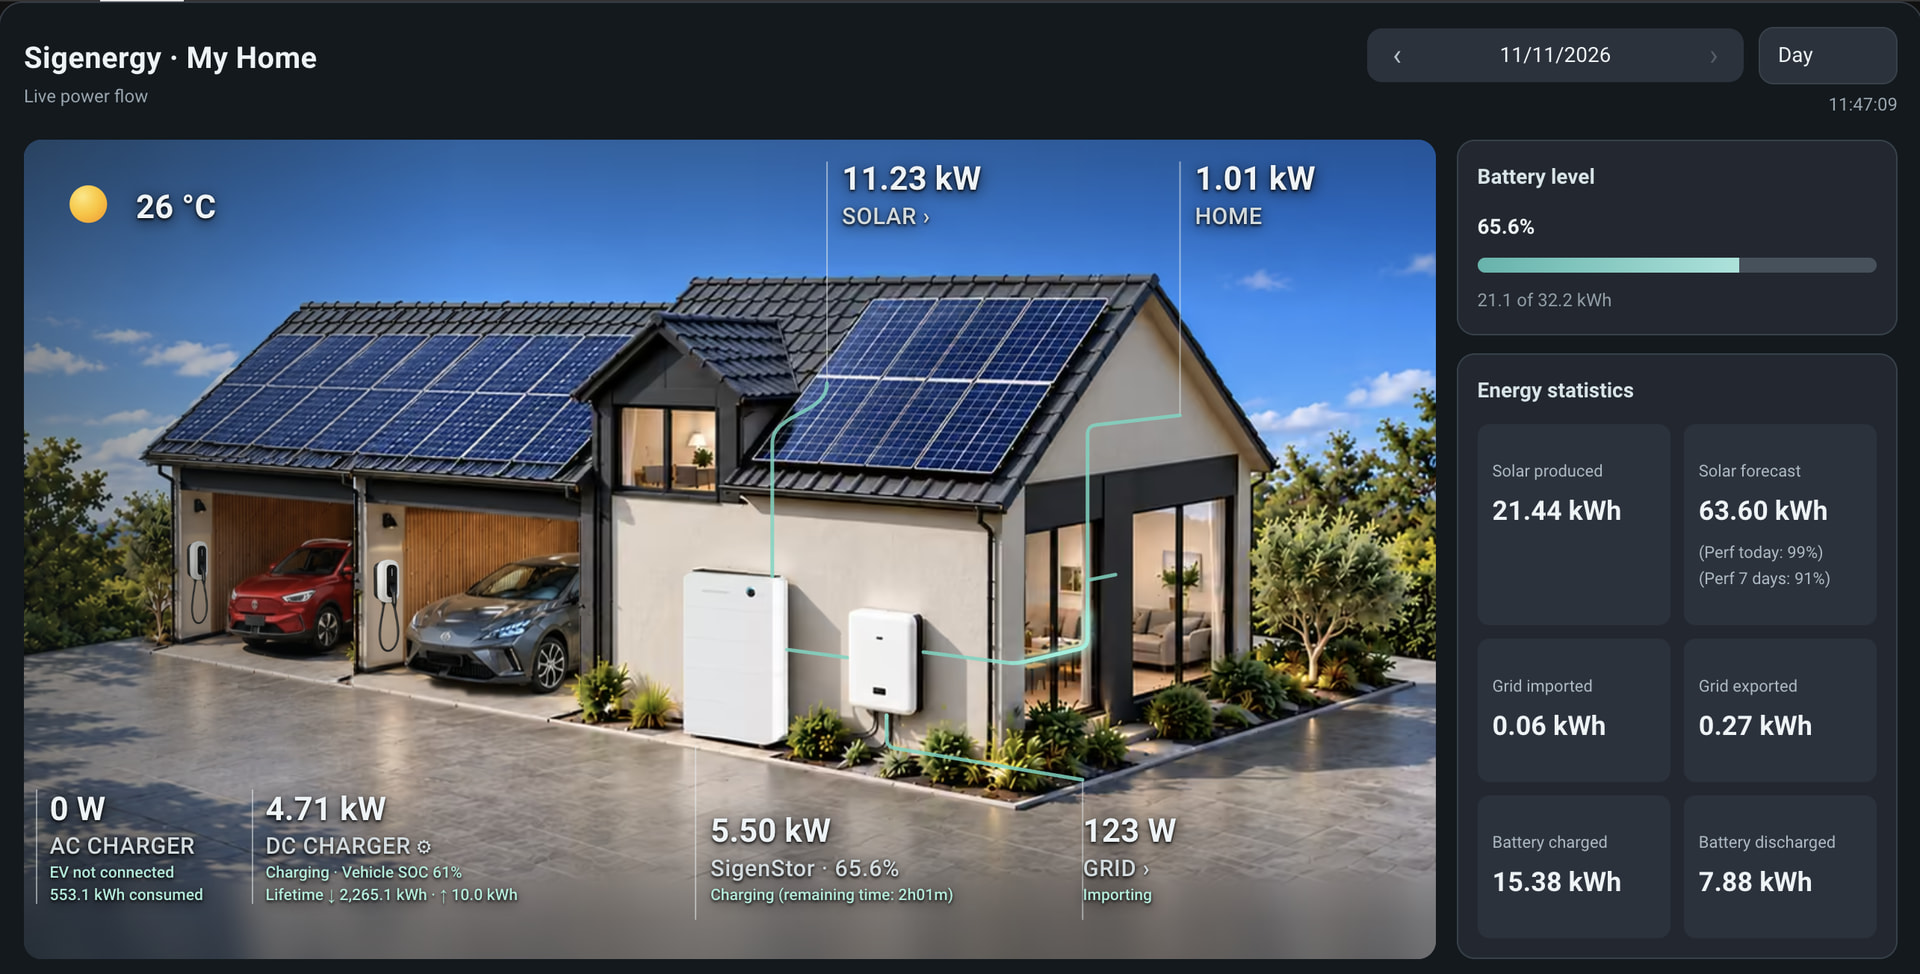
Those might be glossy AI pictures but isn’t that essentially the same ?
Just showing flow between energy sources in the home either momentary or totaled over time?
Besides the current is way more abstract suiting all homes conceptually, while something like this would probably suit no one 
Because don’t they say, not a single same config around …
Don’t make those images too realistic I would think
But, opening up to that concept, what I indeed like is the W / kWh numbers next to each other, and id love to be able to test drive something like that from core. is this only mockup, or do you have it hidden somewhere so we can try ourselves.
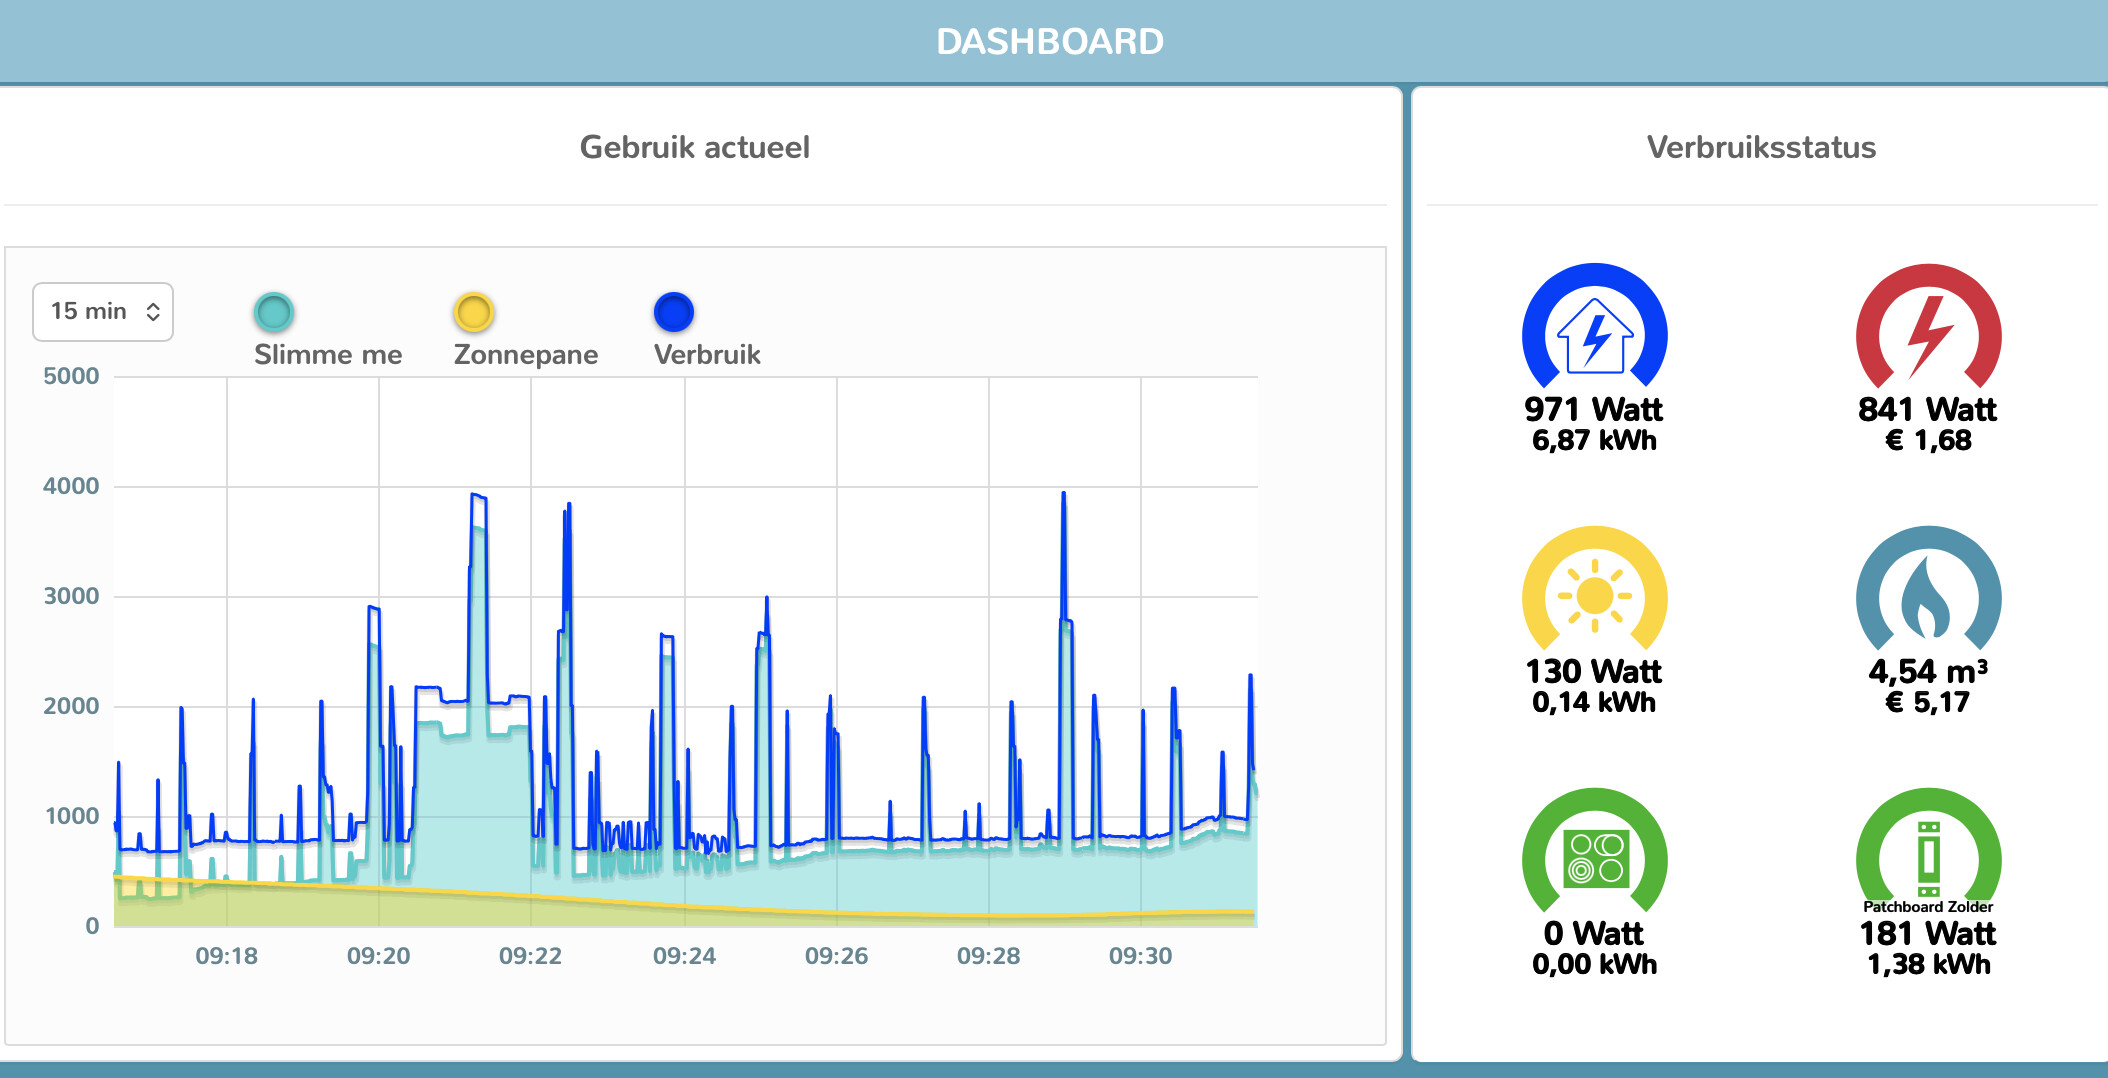
it is a pretty variant of what my energy manager does. I believe you can see there why I opened with the request for a schematic display
the dark blue being the actual home load, while the light blue is the power taken from grid, after solar has been deducted.
to the right the W /kWh in abstracto, like you have them on the nicer Home picture
btw this is from Iungo, a dutch Energy manager, running stable the last 10 year.
I think this mockup intuitively and compactly shows both on the same diagram. Show distribution flow rates through pipes/wires, show distribution flow total quantities in the circles.
You say showing both confuses people, but I think this UI avoids that confusion?
For historical periods not ending NOW, I think the rate labels should stay blank. You could show the average rate in that period, or the most recent rate in the period , or show the current rate now regardless of the period. But I think those are all too confusing with no significant added value.
edited title…
I agree. Just saying why things are the way they are.
I think this is the issue. Having them right next to each other is NOT clear. Putting them both right next to each other makes them seem like the same thing, but they’re not the same thing.
And yet , it’s not very difficult.
Just explain with transportation (walk , ride, fly) and use speed and distance ….
I don’t think that combining both power snd it’s derivative onto single, default diagram is a good idea.
TBH I really doubt most of users inspect momentary values (power) every moment. It might be interesting when monitoring newly added devices. And that’s all - likely nobody look at this again for BAU
Most importantly the power can’t be displayed on such a view for the past moments. What should be shown when looking on yesterday? it could be aggregated values like /max/avg/percentiles. Really?
Having dedicated view for power is another story. Still not sure if worth an effort due to what I said at beginning.
BTW speed/km cannot support this idea for many reasons. These things are far from comparable.
well they are according to the AI’s of this world
Speed versus distance is an excellent analogy for explaining instantaneous power versus accumulated energy consumption.
Think of it this way:
- Speed (km/h) tells you how fast you’re travelling at a particular moment.
- Distance (km) tells you how far you’ve travelled in total.
The relationship is exactly the same in electricity:
- Power (W or kW) tells you how much electricity you’re using at a particular moment.
- Energy (Wh or kWh) tells you how much electricity you’ve consumed over a period of time.
or, another assistant:
Perhaps the simplest wording is:
Power is to energy what speed is to distance.
Or, even more explicitly:
Speed tells you how fast you travel; distance tells you how far you’ve travelled. Power tells you how much electricity you’re using right now; energy tells you how much you’ve used in total.
whatever the options on that may be, lets not divert here on that exegese.
All I asked for was a native HA diagram showing the momentary power flows.
doesnt need to be on 1 card (as I can see how tht would be possible confusing , or simply too cluttered)
doesnt need to be fancy.
all it needs to be is stock frontend and not custom
Yes, I want this card. No, it should not be in one card, way too cluttered and they’re simply not useful in n one card.
I wouldn’t even use it in my energy dashboard, I have a separate dashboard for power.
Not sure why users are saying that two cards looking the same is confusing. I have never found it confusing at all. Once says Power now and one says Energy usage. If the issue is the difference between Power and Energy, well that is more fundamental and nothing to do with what cards look like.
That is like saying tile cards for Kitchen and Bathroom light is confusing. The difference being the title.