after tons of experimentation with different weather integrations and custom lovelace cards… I’ve finally settled on a near copycat of what i consider to be a terrific 10 day outlook, wunderground’s graph.
For a good long while, I was relying on capture-website , narrowed down to the specific DIV, and filtering out a couple headers to tighten it up… screenshot below for comparison, worked ok, but didn’t have dark mode, wasn’t interactive, and was fairly dense given the small screen realestate i afforded it on my dashboards. I set the screen capture on an hourly cron and exposed the PNG via a live camera card so it was constantly refreshed.

Also – lived in fear that the weather channel would eventually kill or significantly change the code on this page… so it was on a short list to figure out how to replicate this using raw data in HA. And I’ve done so with apexcharts and pirateweather (although you should be able to use most any weather entity with a forecast… nothing unique about my pirateweather impl):

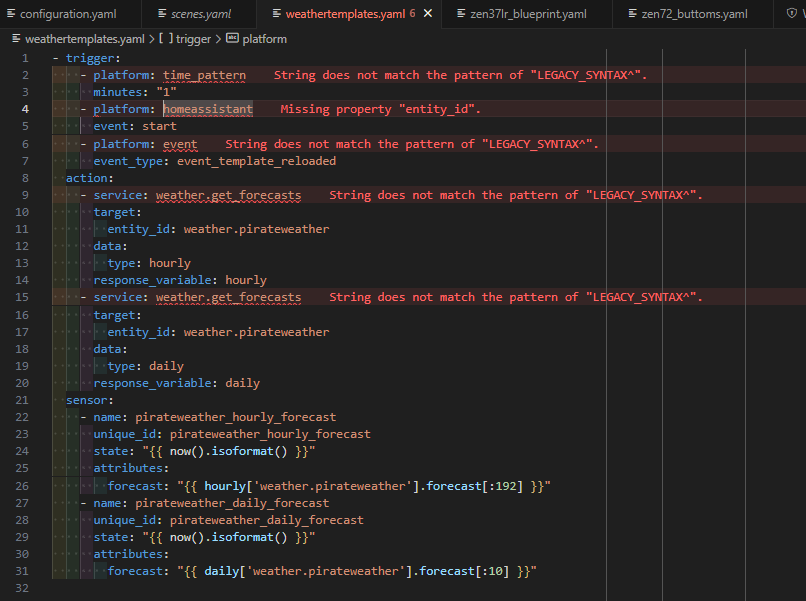
now – i did have to first split out the forecast dict from the weather entity, a well discussed and published workaround for accessing forecast attributes:
- trigger:
    - platform: time_pattern
      minutes: 15
    - platform: homeassistant
      event: start
    - platform: event
      event_type: event_template_reloaded
  action:
    - service: weather.get_forecasts
      target:
        entity_id: weather.pirateweather
      data:
        type: hourly
      response_variable: hourly
    - service: weather.get_forecasts
      target:
        entity_id: weather.pirateweather
      data:
        type: daily
      response_variable: daily
  sensor:
    - name: pirateweather_hourly_forecast
      unique_id: pirateweather_hourly_forecast
      state: "{{ now().isoformat() }}"
      attributes:
        forecast: "{{ hourly['weather.pirateweather'].forecast[:192] }}"
    - name: pirateweather_daily_forecast
      unique_id: pirateweather_daily_forecast
      state: "{{ now().isoformat() }}"
      attributes:
        forecast: "{{ daily['weather.pirateweather'].forecast[:10] }}"
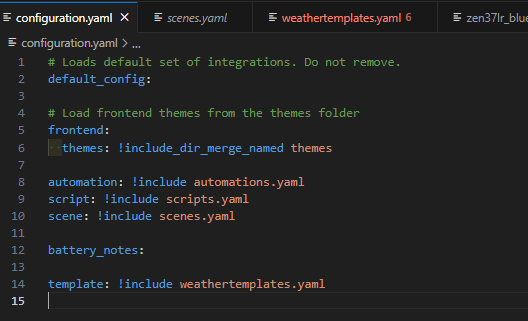
and my apex code, for anyone else that likes this approach…
type: custom:apexcharts-card
card_mod:
  style: |
    ha-card {
      border: solid 0px;
      background: none;
    }
graph_span: 7d
span:
  start: hour
update_interval: 1h
# layout: minimal
apex_config:
  # chart:
  #   height: 250px
  dataLabels:
    enabled: true
  legend:
    position: 'top'
    horizontalAlign: 'right'
    floating: true
    # fontSize: '14px'
    # show: false
  xaxis:
    labels:
      format: 'ddd'
  grid:
    show: false
  annotations:
    xaxis:
      # - x: '${new Date(states["sun.sun"].attributes.next_rising).getTime() }'
      # - x: EVAL:new Date( {{as_timestamp(states["sun.sun"].attributes.next_setting)}} )
      - x: EVAL:new Date().setHours(20,0,0)
        x2: EVAL:new Date().setHours(20,0,0) + 10*60*60*1000
        borderColor: none
        fillColor: dimgray
        opacity: 0.2
        label:
          text: ☾
          borderWidth: 0
          offsetX: 8
          style:
            color: gold
            background: '#0000'
      - x: EVAL:new Date().setHours(20,0,0) + 10*60*60*1000
        borderColor: none
        label:
          text: ☼
          borderWidth: 0
          offsetX: 8
          style:
            color: gold
            background: '#0000'
      - x: EVAL:new Date().setHours(20,0,0)                       + 24*60*60*1000 *1
        x2: EVAL:new Date().setHours(20,0,0) + 10*60*60*1000      + 24*60*60*1000 *1
        borderColor: none
        fillColor: dimgray
        opacity: 0.2
        label:
          text: ☾
          borderWidth: 0
          offsetX: 8
          style:
            color: gold
            background: '#0000'
      - x: EVAL:new Date().setHours(20,0,0) + 10*60*60*1000      + 24*60*60*1000 *1
        borderColor: none
        label:
          text: ☼
          borderWidth: 0
          offsetX: 8
          style:
            color: gold
            background: '#0000'
      - x: EVAL:new Date().setHours(20,0,0)                       + 24*60*60*1000 *2
        x2: EVAL:new Date().setHours(20,0,0) + 10*60*60*1000      + 24*60*60*1000 *2
        borderColor: none
        fillColor: dimgray
        opacity: 0.2
        label:
          text: ☾
          borderWidth: 0
          offsetX: 8
          style:
            color: gold
            background: '#0000'
      - x: EVAL:new Date().setHours(20,0,0) + 10*60*60*1000      + 24*60*60*1000 *2
        borderColor: none
        label:
          text: ☼
          borderWidth: 0
          offsetX: 8
          style:
            color: gold
            background: '#0000'
      - x: EVAL:new Date().setHours(20,0,0)                       + 24*60*60*1000 *3
        x2: EVAL:new Date().setHours(20,0,0) + 10*60*60*1000      + 24*60*60*1000 *3
        borderColor: none
        fillColor: dimgray
        opacity: 0.2
        label:
          text: ☾
          borderWidth: 0
          offsetX: 8
          style:
            color: gold
            background: '#0000'
      - x: EVAL:new Date().setHours(20,0,0) + 10*60*60*1000      + 24*60*60*1000 *3
        borderColor: none
        label:
          text: ☼
          borderWidth: 0
          offsetX: 8
          style:
            color: gold
            background: '#0000'
      - x: EVAL:new Date().setHours(20,0,0)                       + 24*60*60*1000 *4
        x2: EVAL:new Date().setHours(20,0,0) + 10*60*60*1000      + 24*60*60*1000 *4
        borderColor: none
        fillColor: dimgray
        opacity: 0.2
        label:
          text: ☾
          borderWidth: 0
          offsetX: 8
          style:
            color: gold
            background: '#0000'
      - x: EVAL:new Date().setHours(20,0,0) + 10*60*60*1000      + 24*60*60*1000 *4
        borderColor: none
        label:
          text: ☼
          borderWidth: 0
          offsetX: 8
          style:
            color: gold
            background: '#0000'
      - x: EVAL:new Date().setHours(20,0,0)                       + 24*60*60*1000 *5
        x2: EVAL:new Date().setHours(20,0,0) + 10*60*60*1000      + 24*60*60*1000 *5
        borderColor: none
        fillColor: dimgray
        opacity: 0.2
        label:
          text: ☾
          borderWidth: 0
          offsetX: 8
          style:
            color: gold
            background: '#0000'
      - x: EVAL:new Date().setHours(20,0,0) + 10*60*60*1000      + 24*60*60*1000 *5
        borderColor: none
        label:
          text: ☼
          borderWidth: 0
          offsetX: 8
          style:
            color: gold
            background: '#0000'
      - x: EVAL:new Date().setHours(20,0,0)                       + 24*60*60*1000 *6
        x2: EVAL:new Date().setHours(20,0,0) + 10*60*60*1000      + 24*60*60*1000 *6
        borderColor: none
        fillColor: dimgray
        opacity: 0.2
        label:
          text: ☾
          borderWidth: 0
          offsetX: 8
          style:
            color: gold
            background: '#0000'
      - x: EVAL:new Date().setHours(20,0,0) + 10*60*60*1000      + 24*60*60*1000 *6
        borderColor: none
        label:
          text: ☼
          borderWidth: 0
          offsetX: 8
          style:
            color: gold
            background: '#0000'
    yaxis:
      - y: 10
      - y: 32
      - y: 80
# now:
#   show: true
#   color: red
yaxis:
  - id: left
    decimals: 0
    min: ~0
    max: ~80
    apex_config:
      tickAmount: 4
      forceNiceScale: true
      axisTicks:
        show: false
  - id: right
    opposite: true
    show: false
    min: 0
    max: 100
all_series_config:
  stroke_width: 2
  # extend_to_end: false
  show:
    legend_value: false
series:
  - entity: sensor.pirateweather_hourly_forecast
    name: temperature
    unit: °F
    color: red
    yaxis_id: left
    data_generator: |
      return entity.attributes.forecast.map((entry) => {
            return [new Date(entry.datetime), entry.temperature];
          });
  - entity: sensor.pirateweather_hourly_forecast
    name: feels like
    unit: °F
    color: purple
    yaxis_id: left
    data_generator: |
      return entity.attributes.forecast.map((entry) => {
            return [new Date(entry.datetime), entry.apparent_temperature];
          });
  - entity: sensor.pirateweather_hourly_forecast
    name: wind
    unit: mph
    color: green
    yaxis_id: left
    data_generator: |
      return entity.attributes.forecast.map((entry) => {
            return [new Date(entry.datetime), entry.wind_speed];
          });
  - entity: sensor.pirateweather_hourly_forecast
    name: cloud coverage
    unit: '%'
    type: area
    color: grey
    opacity: 0.5
    stroke_width: 0
    yaxis_id: right
    data_generator: |
      return entity.attributes.forecast.map((entry) => {
            return [new Date(entry.datetime), entry.cloud_coverage];
          });
  - entity: sensor.pirateweather_hourly_forecast
    name: precip
    unit: '%'
    type: area
    color: dodgerblue
    opacity: 0.6
    stroke_width: 0
    yaxis_id: right
    data_generator: |
      return entity.attributes.forecast.map((entry) => {
            var x = [new Date(entry.datetime), entry.precipitation_probability];
            return x == 0 ? null : x
          });
few notes on this apex graph:
- it auto updates hourly, i havn’t noticed any refresh related issues after a week or so of use
- the x-axis annotations for sunset and sunrise are hard coded. I wanted to use the sun’s next_setting and next_rising for the current day, and then some simple 24 hour math increments for the upcoming days… but i couldn’t get the template to work properly, and i found that the annotations were not auto-updated hourly. Minor inconveniences, maybe someone wants to use this or enhance it
- i didn’t include dew point or pressure from the original inspiration, as i was trying to minimize too much on the screen, but that wouldn’t be hard to add if someone wanted
- this is only forecast data, so the graph always starts at NOW. I set the span window to update hourly too so the period from midnight to NOW wasn’t just a blank hole… ideally i guess it’d be nice to show actual historical data there… I have not attempted to include that data in the generated data… i imagine that wouldn’t be that hard though. Might even be fun to scroll back a day or two if you wanted.
- also have not gotten to the wind direction annotations, but no reason to think it couldn’t be added like this