Hi chaps,
I’m getting the following error in my logs when using this script. It seems to be working, just wondering if there was a fix ot something i’ve done wrong?
https://cdnjs.cloudflare.com/ajax/libs/dagre-d3/0.6.1/dagre-d3.js:0:0 Script error
Hi chaps,
I’m getting the following error in my logs when using this script. It seems to be working, just wondering if there was a fix ot something i’ve done wrong?
https://cdnjs.cloudflare.com/ajax/libs/dagre-d3/0.6.1/dagre-d3.js:0:0 Script error
Hi,
Just discovered this add-on today, despite having used HA for almost a year. Definitively a must when using Z-wave, and I think it should be part of HA if Z-wave was enabled.
Thanks for Z-wave graph!
Tried downloading the code from git hub, created a panels directory and put the file there and modified my configurations.yaml file. Unfortunately, all I get is a blank page with an empty box in the lower right hand corner. The home-assistant.log file gives a very long error:
2019-08-28 12:31:55 ERROR (MainThread) [frontend.js.latest.201908050] data:text/javascript;charset=utf-8,%0A%20%20class%20HaPanelZWave%20extends%20Polymer.
...
panel_custom%2Fzwavegraph2.js%0A:0:0 Script error.
Can anyone help?
Pretty much every time I use my graph page, I get the same thing and a refresh fixes it.
Very cool project, thanks for sharing!
I also had the really tiny graph problem (using chrome), but refreshing the page fixed it. The graph also works fine over the Nabu Casa connection too.
Here’s mine looks very…not exciting. Is it normal for a mesh network to not be meshing? Everything has a direct connection to my hub ( HUSBZB-1), and not any sort of hopping amongst each other. Is this because they all have a good connection to the hub and do not need to repeat themselves? Is this efficient?
:EDIT:
If I hover over a node, some dim while others stay lit up. I’m assuming this is showing some sort of relationship between them, but what exactly? The one’s that it would hop to if it needed to?
It’s good that they can all directly connect to the hub, zwave has a limit of 4 hops to reach the hub. The graph shows the optimal route to the hub. If you hover of each node you will see the “neighbors” of each node. As long as a node is a repeater then any of it’s neighbors can communicate via that node back to the hub (eg: node 1 = hub, node 2 = switch, node 3 = switch2. if node 2 has a neighbor of node 1 and node 3 and node 3 is a repeater. Then if node 2 couldn’t communicate to node 1 then it could hop through node 3 to reach node 1.) But the less hops a node needs to communicate with the hub the better.
Gotcha, OK awesome.
Just committed version 2.1: (20 September 2019)
- added Tools to graph legends so you can easily navigate to Z-Wave Network Management
- fixed (hopefully) the problem with the graph requiring page reload when navigating to it

Initial testing results of the refresh issue are good. So far, no need to refresh. Thanks for the update!
I have been using Z-Wave graph for quite a while and read about your commit to version 2.1. Where can I find it?
Thanks!
Here you go!
Thanks! I have saved it to my /config/panels folder and restarted HA, but I don’t see any “Tree Layout”, “Neighbors” or “Tools” as in the above picture. My config looks exactly as the one above.
You need to flush your browser cache and do a hard reload. Or add some random parameter to the URL In the config so that the browser does not use the cached version.
Worked, thanks!
it’s in a gist, those are actually repos that you can star and subscribe to. 
Refreshed to version 2.2 - you can now turn grouping off - on a large network this may sometimes increase the clarity of the graph.
Hello,
I have now got this working but I can see that there is one Z-wave node that is not shown as connected to te network but it works very well.
It is a Telldus switch and I have several of those but this one wont show up in green, but it´s grey.
Any suggestions?
Thanks in advance - and great tool!
It would be greate if the zwave graph are available at HACS
Hi Nigel, thank you for this nice tool.
I have used it for a few days, but I just noticed a strange thing is happening.
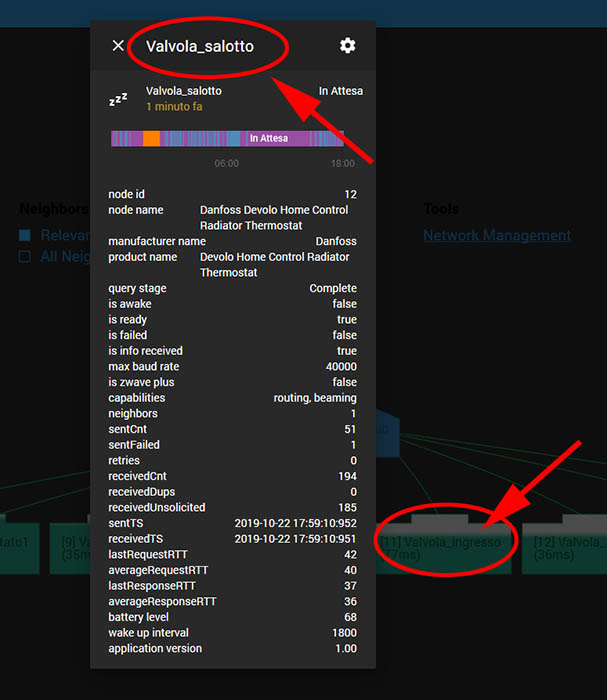
My network is composed of 6 radiator valves and an Aeotec gen 5 stick as a gateway. Since yesterday two valves started to appear as disconnected in Zwavegraph. Then I noticed if I click on the image representig the valve, the popup which opens refers to a completely different valve! For instance, image for valve A, if clicked, points to details of valve B and so on. Every image is coupled to wrong valve detail informations! Am I doing anything wrong? !
Please see the attached picture.


