So, I have finally gotten all of my Z-Wave devices back in (with the exception of one - waiting on a part for one of my Schlage locks) – and have some questions:
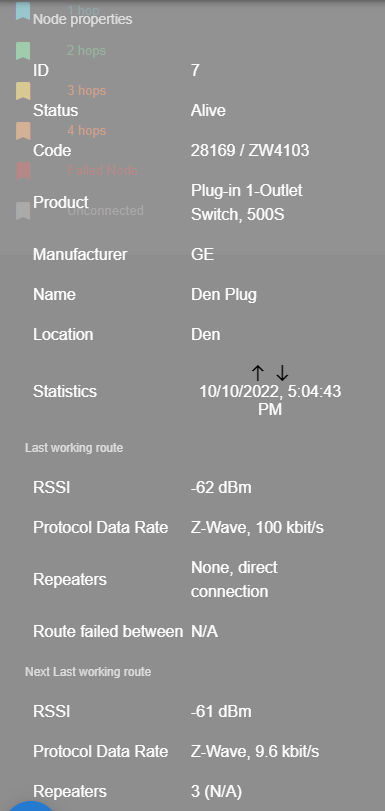
Any idea why this one device (it is less than 12 feet from the controller and in the same room (other side) as the BLUE Circled one) did not connect to the Controller like all the others? I have tried every thing…multiple HEAL and RE-INTERVIEW (really do not want to EXCLUDE and INCLUDE as that changes the Node Number – and I put a little number sticker on all of them as I add them) . Is there any way to fix this?
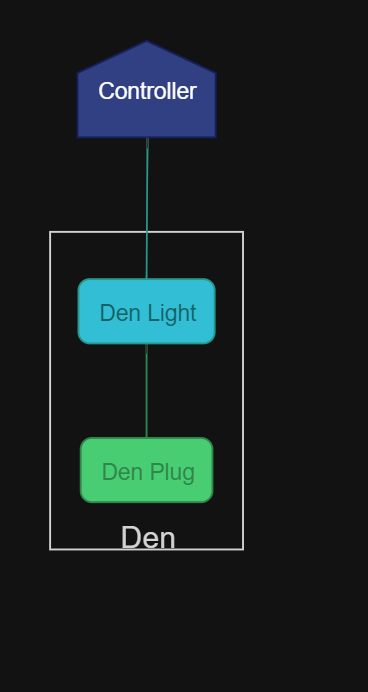
Please explain. The graph looks pretty ‘self-explanatory’ - the teal (are connected to the Controller) the green one is not.
I have done multiple heal and re-interview - this never changes. I find it odd that only 1 device from all of them is like this - it is in the same room as the controller, the Den Light, the Back Door (the one big room which is my Den and Kitchen and Breakfast nook).
There’s nothing to explain. The graph does not show routes or hops. It just shows you your nodes in a pretty format. The graph is missleading you to thinking it’s showing actual routes when it’s showing you what is equivalent to “estimated routes”.
Sorry to sound crass - but that makes no sense at all. The whole point of the graph/map (just like in ZHA for Zigbee) is see to see where things are connected. If it does not show an accurate representation of the map - why is it there?
It is incredibly frustrating to be told “just ignore it - it does not do anything”.
Sorry, I can lie to you if you want. Do you want the truth or a lie? The graph is an estimation at best. It does not map out your actual network. It is pointless. When the driver (zwave js) offers a way to actually get the network connections, then the graph will be correct. Last I checked, that function hasn’t been added. So you’re gonna be frustrated, sorry.
It’s a graph of the “network neighbors” that the devices and controller report, which are known to be inaccurate. I don’t think there’s ever been a claim that it’s a live connectivity graph, people just assume it. Having a node as a neighbor does not imply that a route will be chosen to go through that node. It’s a possibility, but the graph does not tell you that. Use the Health Check functionality to see how a node might route messages. As petro has implied, a proper live connectivity graph would need to be smarter and track statistics about the nodes and network.
Oh god, that map thing again. This thing is the absolute anti-thesis of good user experience. There have been endless threads about that thing, all ending with the same result - absolutely nothing. The map is basically random. It contains no usable information. It represents one theoretical possible routing out of hundreds / thousands / millions of possibilities. It’s completely pointless. It should have been removed ages ago. From a github thread about this thing the developer basically said they’re keeping it because it looks pretty and people like pretty graphs. Even if they’re misleading and counterproductive. Go figure. I stopped even trying to understand this.
And yes, of course it looks like a connectivity graph. And of course people will assume that it is one. Duh.
So yeah, as the other guys said, ignore it. Facepalming on your keyboard while doing so is optional.
You can look at the official docs for a description of the Network Map and Health check features.
In order to use this feature you need to open Network Graph tab, here you can visualize your Z-Wave mesh network and check connectivity issues between nodes and the controller.
You are left to interpret what “visualize your Z-Wave mesh network means”, but it I can certainly tell you it’s not showing connectivity. The “check connectivity issues” is a reference to the health check functionality.
There is also a disclaimer about the issue under discussion, so take it from the source:
In some networks, the neighbor information used to draw this graph can be wrong and nodes may appear to be not connected, even if they are. Refer to the route information (see below) to know how commands are actually routed.
So just use the map for what it’s best for, accessing the health check feature. And just because a health check fails doesn’t mean a node isn’t working. It’s just a judgement about the quality of the observed routes.
FWIW, I had a GE device I updated firmware on, worked perfectly but failed the health check 100%. I factory reset the switch, re-added it, and it’s back to passing.
I had considered a FULL RESET and RE-ADD - but apparently once I do that - I will have a hole where that Node is. Node 7 cannot be used again until I reach the maximum number of nodes supported by the controller (which I believe is like 1000) and then I could use it again.
I hate having a gap. I had that issue when I was using SmartThings and drove me batty.
I would have to EXCLUDE everything - reset the controller and re-add everything again. Which I guess in the grand scheme of things is I choose the ‘lesser of two evils’. LOL
However, you can avoid this by shutting down Z-Wave JS, factory resetting the device, re-starting Z-Wave JS then performing a replace failed node operation with the now failed device…
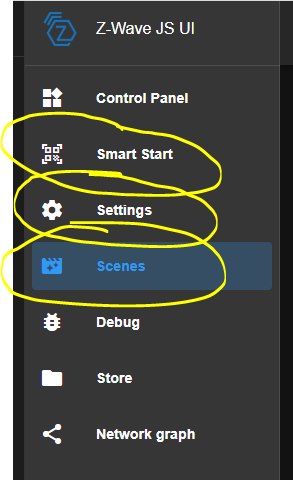
SmartStart - manage devices via QR codes.
Settings - pretty self-explanatory, configure the application settings
Scenes - MQTT scenes. Irrelevant if you don’t use MQTT.
sounds confusing - I will have to look into this. As the device is not failed at the moment…but I see what you mean. If I RESET the device and restart Z-Wave - it will be. It is a ZWave+ device, but does not have S2.
I have a few with QR codes - but I do not use them. I INCLUDE them like everything else. The ZOOZ devices make you enter a PIN - which the QR code would eliminate.
I thought that ZWave JS UI was a replacement for MQTT - I was directed to that when I asked about the depreciated ZWave2Mqtt - as I also have Zigbee and I was looking at what benefits MQTT would give me for both ZW and ZB.


 That’s a bit extreme.