Wondering if anyone is seeing the same things I am. I’m using the Fronius integration to obtain data from my inverter and smart meter. The energy dashboard is showing export overnight even though the sensor that represents the amount of energy exported has not changed.
Also as per the third image, the dashboard is not displaying energy costs, even though the cost sensor has a value.
I’m using a template sensor to convert to float and divide by 1000. I guess it could be rounding? But the sensor state (both the template and the fronius sensor) hasn’t changed during that period so I’m not sure where the 0.04kWh every hour comes from. I’ll go back to the raw Wh sensors and see if it’s still there.
This update made the Aeotech Siren 6 100% compatible with z-waveJS without the need to use the nodered flows/mqtt that was a solution but had some flaws/hiccups.
waiting on my shelly em to test the new energy area.
Cost calculation was working yesterday but it is not calculated on the dashboard to show you hey you used 5kwh so multiply by cost and show it, it is actually an entity that accumulates over time so just changing the price won’t show up until you use it and every time you change the sensor for the grid consumption it resets to zero.
I can’t really tell if mine is working today as I played with my consumption and now I’m 100% solar so probably won’t find out until tonight.
Thanks, Scott! This is the answer. Instantly worked. I wonder if it needed to be considered a “strip” the whole time as I didnt even need to “reload” the integration like I normally needed to. I can try it out on my dev instance as its behind by a few versions to test it out for curiosity sake. Not sure what we can do to include this in “break fix” notes or the integration page, but it needs to be updated to reflect this. I doubt we are the only 2 with the issue.
Unfortunately I changed over to the Wh sensors and have lost the previous entities, but that 6.66 would have been since the sensor was configured the day before - it was only configured around 5pm and went through the night.
Since changing to the fronius sensors there is a cost showing up now, reflecting the created entities, incorrect for the whole of today as they only started about 2.5 hours ago. Guess I’ll have to wait for a full day (tomorrow) to see some accuracy.
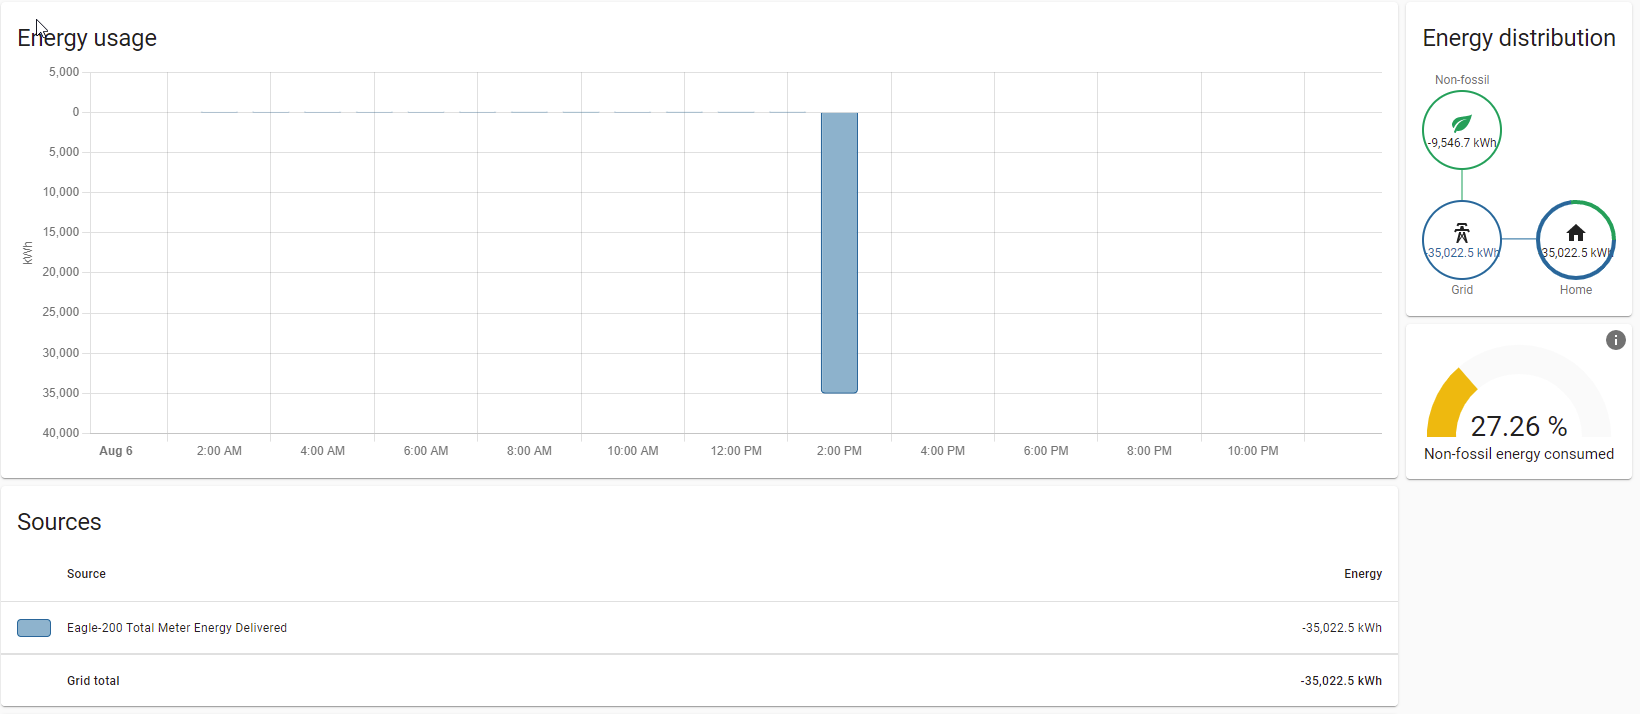
I’m using a Rainforest meter total energy delivered(a total from the meter which is about 35,000kwh) as my energy dashboard reference.
HA was reading the kwh brilliantly and breaking it down per hour. Then suddenly the graph has gone into negative territory by a huge margin. the graph is now -35,022kwh.
Is there a way to reset the data and get rid of the erroneous data point? alternatively is there a way to ignore impossible data in case of a meter error like this seems to be?
I know the energy dashboard need/uses other items, but I think it’s a missed opportunity to release it as a Lovelace dashboard with people can copy and alter, maybe something for new release.
I didn’t read whole thread, so I guess I’m not the only one suggesting this.
Also would it be nice if you can tag switches, lights and anything that uses same amount of power with a static power usage value, so the energy dashboard can use this information for calculations when device is switched on, (or even also low for standby power value) without the need to have a power plug.
Take a look at this custom component made by bramski.
You can use it to have a static power usage value, standby value or even calculate power usage for lights.
Please let me know how you go, I still can’t quite figure out the fronius setup. I am getting correct solar production but the consumption isn’t right.
Logger: homeassistant.setup
Source: setup.py:173
First occurred: August 5, 2021, 8:31:39 PM (1 occurrences)
Last logged: August 5, 2021, 8:31:39 PM
Setup failed for ecowitt: Unable to import component: cannot import name ‘VOLT’ from ‘homeassistant.const’ (/usr/src/homeassistant/homeassistant/const.py)