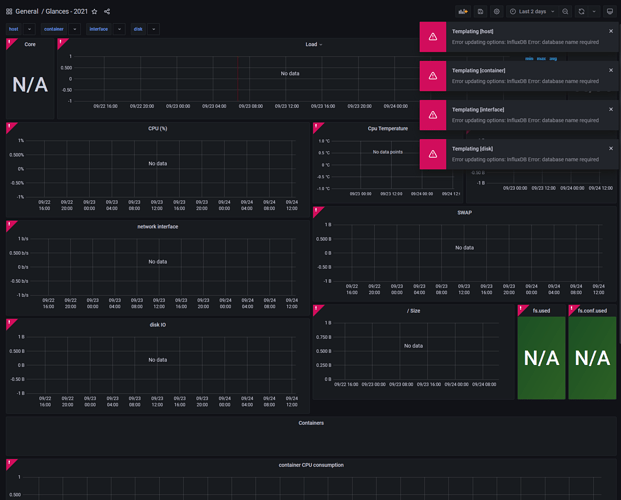
I think I am going to give up…
Do no give up yet @sender - there could be just a little thing which is blocking it all.
Let’s debug your setup:
Have you checked in the InfluxDB that data flows from Glances into database?
Frenck doing checkup (at 9:43):
Yes I do see data in influxdb
@sender, and now as you have that glances influxdb datasource set up in the Grafana, if you import the dashboard again, can you select the Glances datasource from the list and it still gives those red errors “! database name required”?
Yes indeed like that… 
@sender, let’s check if you actually can see the data from InfluxDB in Grafana.
Make new empty dashboard with empty panel in Grafana
And then make an query to glances -datasource like “from” localhost.load, “select” field(min15):
Do you see the graph popping up?
Hey nikop. Thank you very much for your brilliant work done. Surprisingly for me, when I followed Frenck’s YouTube video and then downloaded Nicolargo’s dashboard from Grafana.com (updated two months ago!) it didn’t work for me. I was frustrated. Luckily I found this topic. Your dashboard is working for me like a charm, so I really appreciate your effort. 
I just did set this up and it was working great directly after I imported your dashboard, @nikop, thanks a lot!
However whenever I now try to open the new dashboard in Grafana it starts to render (I can see the number of CPU cores in the top left) but then the page instantly crashes in Google Chrome with error 5.
Closed the browser, emptied the cache but no change.
Now after a few minutes it suddenly displays again, really bizarre…
Let’s see if it stays stable now
Works for me as well, thanks @nikop !
Note that Frencks excellent tutorial workes still except for the dashboard in Grafana using Glances, which you’ve solved.
Stills works out of the box - great job!
Only thing with most recent version is that no container data is showing?
I got containers working again, here’s the SQL Statement:
SELECT mean("cpu_percent") FROM "localhost.containers" WHERE ("name" =~ /^$container$/ AND "hostname" =~ /^$host$/) AND $timeFilter GROUP BY time($__interval) fill(none)

SELECT mean("memory_usage") FROM "localhost.containers" WHERE ("name" =~ /^$container$/ AND "hostname" =~ /^$host$/) AND $timeFilter GROUP BY time($__interval) fill(none)
Please ignore my ignorance, but where do you enter these SQL-commands to get containers to show up please?
UPDATE: Edited the JSON model from settings:
Search for ‘cpu_percent’ and ‘memory_usage’ and replace the queries between double quotes.
However, it is not working yet so perhaps a refresh/reload is needed. No data still:
I’ll update this post if it starts working after a while.
Hey thanks for adding that note. An error pops up. Anyone a clue on what I’m doing wrong here please?

Configuration (copy 'n paste form above post:
Got it working when also changing measurement from “localhost.docker” to “localhost.containers”
Working code snippet based on the Grafana - 2022 dashboard:
          "measurement": "localhost.containers",
          "orderByTime": "ASC",
          "policy": "default",
          "query": "SELECT mean(\"cpu_percent\") FROM \"localhost.containers\" WHERE (\"name\" =~ /^$container$/) AND $timeFilter GROUP BY time($__interval) fill(none)",
I too have issues getting Grafana to show any data in the fields. I’ve been trying multiple things, but I’m sure I’m doing something completely wrong.
I can access Glances data inside Grafana and can even alter a few fields if I want. The issue seems to be that the Glances dashboard hasn’t got any variables, like /^$host$/, to chose from. When I edit a dashboard section, directly enter something like localhost.cpu in the FROM field and delete the WHERE variable, I can get something on the screen.
My settings (after trying many different things from multiple, maybe even obscure, places) in Glances config under influxdb are:
enabled: true
host: a0d7b954-influxdb
port: 8086
interval: 60
ssl: false
version: 2
username: hainfluxuser
password: <password>
database: glances –export influxdb2
prefix: localhost
token: >-
  EjFUTWe8U-MIseEAkaVIgVnej_TrnbdvEcRkaB1imstW7gapSqy6_6-8XD-yd51V0zUUpDy-kAdVD1purDLuxA==
bucket: glances
org: nicolargo
I would love to get this going. Thanks!
Hello,
I had to do the changes posted up here also. Therefor I added an updated version on: Glances 2024
Credits to:
- original work - Glances by nicolargo
- Glances - 2022 by nikopaulanne
- And forum members overhere


