I correct myself, after restarting Homeassistant the problem reappeared again, perhaps before it seemed to work because the previous version 1.21.1 had remained cached.
Now it’s like this:

v2.0.3 Should really fix it. Sorry for the hectic releases ![]()
1 Like
Thank you for the update! Everything seems to be working fine now. ![]()
So, man needs to become sick of some virus, get horizontal on the sofa and be only able to do some mouse clicks.
Finally I’ve mastered this card too ![]() Massive thanks to the creators
Massive thanks to the creators ![]()

2 Likes
Nice!
Out of curiosity, is there a reason why you have the left and middle values show the same? Or will there be another element such as e.g. solar panels as a source?
Unrelated, here’s how mine looks these days (left hand side is actual Power, right hand side is day consumption (linked to energy selector date so can be another day, week, month, …)

Logic is - from left to right:
- Most left is the source (currently only from the grid)
- Second level is the area in the house
- Third level is at device or cluster level
- Fourth level (utmost right) regroups devices into functional groups
1 Like
You got it! Screenshot is made after the Sun moved to the USA ![]() So Solar power is included, just 0 at that moment.
So Solar power is included, just 0 at that moment.
1 Like
I tried alot of configs but my Energy Selection cards keeps showing up empty.
See code I am using. It works for actual power but not for the date selector.
title: Energy Distribution
type: energy-date-selection
views: null
energy_date_selection: true
height: 250
unit_prefix: k
round: 0
convert_units_to: ''
min_box_height: 8
min_box_distance: 5
show_states: true
show_units: true
sections:
  - entities:
      - type: entity
        children:
          - sensor.droger_summation_delivered
          - sensor.wasmachine_summation_delivered
          - sensor.aquarium_summation_delivered
          - sensor.datacenter_summation_delivered
          - sensor.myenergi_zappi_21621507_charge_added_session
          - sensor.bierkoelkast_summation_delivered
          - sensor.vriezer_summation_delivered
          - sensor.tv_receiver_summation_delivered
        name: Totaal verbruik
        entity_id: sensor.p1_meter_energy_import_tariff_1
        color: var(--warning-color)
        remaining:
          name: Unmonitored
  - entities:
      - type: entity
        children: []
        name: Droger
        entity_id: sensor.droger_summation_delivered
      - type: entity
        children: []
        name: Wasmachine
        entity_id: sensor.wasmachine_summation_delivered
      - type: entity
        children: []
        name: Aquarium
        entity_id: sensor.aquarium_summation_delivered
      - type: entity
        children: []
        name: Zappi
        entity_id: sensor.myenergi_zappi_21621507_charge_added_session
      - type: entity
        children: []
        name: Vriezer
        entity_id: sensor.vriezer_summation_delivered
      - type: entity
        children: []
        name: Datacenter
        entity_id: sensor.datacenter_summation_delivered
      - type: entity
        children: []
        name: Bier& Wijnkoelkast
        entity_id: sensor.bierkoelkast_summation_delivered
      - type: entity
        children: []
        childeren: []
        name: TV & Receiver
        entity_id: sensor.tv_receiver_summation_delivered
show_names: true
wide: true
min_state: 0
can you post the code?
My card is not getting to the full width like yours

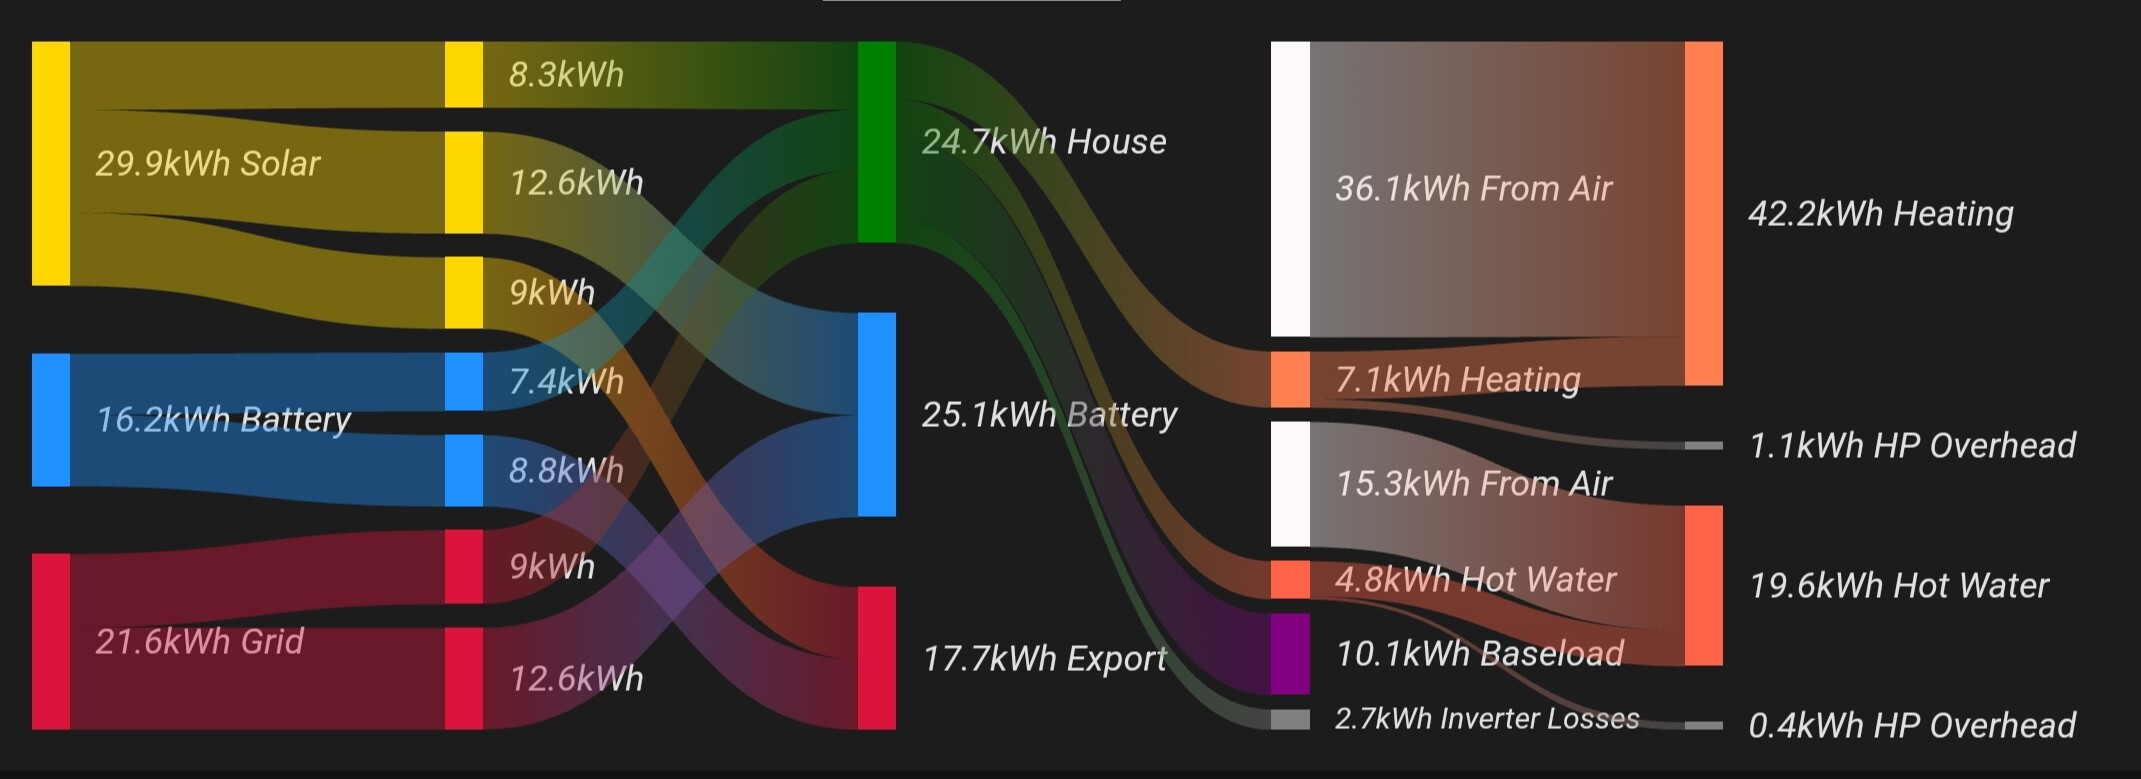
Another way you can treat battery charge/discharge is to have the battery appear in two places:
- discharge as an input on the left;
- charge as an output on the right.
3 Likes
Hello there!
I’m starting to setup this chart but I have an issue using Powerwall Integration: Power on the outcome number from HA for the Tesla Powerwall integration is charge when discharge the battery to supply home (positive on discharging using one of sources, from solar or from grid) and similar into the Site Power from Grid (positive when Grid supply home or battery, negative when I sell energy to grid).

Now into Sankey Chart I try to put as second Section both Battery (to show is charging, in PW integration when is negative) and SIte (to show is selling to grid when is negative) and here come the problem: the Card do not “use” the negative power (for this second section) so I cannot have the indication if power that home do not use is charging battery or sell to the grid. I just bypass the issue for battery usign the “Remaning Parent State” to show that is doing something with that excess of production on Type but of course this is not showing if I really charge the battery PW or selling to grid like the following picture:

Following the code I’m using now:
height: 500
unit_prefix: k
round: 1
convert_units_to: ''
co2_intensity_entity: sensor.co2_signal_co2_intensity
gas_co2_intensity: 2351.6459999999997
min_box_height: 3
min_box_distance: 40
show_states: true
show_units: true
sections:
  - entities:
      - type: entity
        children:
          - sensor.casa_potenza_di_carico
          - sensor.casa_potenza_della_batteria
          - sensor.casa_potenza_del_sito
        entity_id: sensor.casa_potenza_solare
        color: yellow
        name: Potenza Solare
      - type: entity
        children:
          - sensor.casa_potenza_di_carico
        entity_id: sensor.casa_potenza_della_batteria
        color: yellow
        name: Potenza Batteria
        icon: mdi:battery-charging
      - type: entity
        children:
          - sensor.casa_potenza_di_carico
          - sensor.casa_potenza_della_batteria
        entity_id: sensor.casa_potenza_del_sito
        icon: mdi:power-plug
        name: Rete Elettrica
    sort_group_by_parent: false
  - entities:
      - type: entity
        children:
          - sensor.lavatrice_mss310_power_w_main_channel
          - sensor.lavastoviglie_mss310_power_w_main_channel
          - sensor.spina_giardino_mss310_power_w_main_channel
          - sensor.presaterrazza_mss310_power_w_main_channel
          - sensor.daikin_sopra_compressor_estimated_power_consumption
          - >-
            sensor.daikin_sala_da_pranzo_consumo_energetico_stimato_del_compressore
          - sensor.daikin_salotto_consumo_energetico_stimato_del_compressore_2
          - >-
            sensor.daikin_entrata_casetta_consumo_energetico_stimato_del_compressore
          - sensor.presa_zb_bagno_piccolo_potenza
          - sensor.tz3000_okaz9tjs_ts011f_potenza
          - sensor.presa_zb_telecomandata_cucina_potenza_2
        entity_id: sensor.casa_potenza_di_carico
        color: red
        name: Potenza Consumata
      - type: remaining_parent_state
        children: []
        entity_id: sensor.casa_potenza_della_batteria
        color: yellow
        icon: mdi:solar-power-variant
        name: Ricarica Batteria
      - type: remaining_parent_state
        children: []
        entity_id: sensor.casa_potenza_del_sito
        name: Potenza Venduta
  - entities:
      - type: entity
        children: []
        entity_id: sensor.lavatrice_mss310_power_w_main_channel
        color: red
        name: Lavatrice
      - type: entity
        children: []
        entity_id: sensor.lavastoviglie_mss310_power_w_main_channel
        color: red
        name: Lavastoviglie
      - type: entity
        children: []
        entity_id: sensor.spina_giardino_mss310_power_w_main_channel
        color: red
        name: Carica EV
      - type: entity
        children: []
        entity_id: sensor.presaterrazza_mss310_power_w_main_channel
        color: red
        name: Presa Terrazza
      - type: entity
        children: []
        entity_id: sensor.daikin_sopra_compressor_estimated_power_consumption
        color: red
        name: Clima Sopra
      - type: entity
        children: []
        entity_id: >-
          sensor.daikin_sala_da_pranzo_consumo_energetico_stimato_del_compressore
        color: red
        name: Clima Sala da Pranzo
      - type: entity
        children: []
        entity_id: sensor.daikin_salotto_consumo_energetico_stimato_del_compressore_2
        color: red
        name: Clima Salotto
      - type: entity
        children: []
        entity_id: >-
          sensor.daikin_entrata_casetta_consumo_energetico_stimato_del_compressore
        color: red
        name: Clima Entrata Casetta
      - type: entity
        children: []
        entity_id: sensor.presa_zb_bagno_piccolo_potenza
        color: red
        name: Presa Bagno Piccolo
      - type: entity
        children: []
        entity_id: sensor.tz3000_okaz9tjs_ts011f_potenza
        color: red
        name: Frigorifero
        icon: mdi:fridge
      - type: entity
        children: []
        entity_id: sensor.presa_zb_telecomandata_cucina_potenza_2
        color: red
        name: Air Purifier
energy_date_selection: false
type: custom:sankey-chart
show_icons: true
show_names: true
wide: true
min_state: 0
Someone has an idea how I can solve the issue somehow?
Thanks in advance!
The card ignores negative values as there is no universal way to handle them. Best to create a template entity in HA that turns the negative to positive and use that in the card as well
2 Likes

This is such an awesome card, thanks MindFreeze for the great work!
Just released v3.0.0-beta with vertical layout!
You may have to enable beta versions of the card in HACS to download it. It contains breaking changes and I may introduce more before it makes it to non-beta status.
But if anyone wants to try it out early, now is your chance ![]()
2 Likes
Could you share you code for this please, I’ve tried to do this in the past and couldn’t get a solar to battery path
It’s available to all, you don’t need to enable betas (might be better to avoid this for people who don’t want beta versions BTW).
running well here, might try vertical later, not sure yet.
Can’t believe i’ve been typing this wrong and have not realised!
I noticed after the latest update that my middle section (Total Energy Used) is now aligned with the centre instead of the top of the graph as it was previously

.
I could not see a setting to control this, so it’s just as well I like the new layout.
I’m enjoying the new vertical layout which just switched over automatically. Very good on mobile device.

