I just discovered this yesterday. It’s pretty neat.


Also just discovered this. Looks pretty cool. Just need to figure out how to get the grid information out of the HA energy management. And after that just add my consumers using auto-entities 
?
You put it in.
You need an entity for Sankey that reports the total. But since I am not measuring it with a real sensor, I would like to use the total “grid” value that HA energy integration is calculating. But I have not found the sensor/entity name yet. Only the card information for the different energy cards that automatically use it.
But since the HA Energy integration needs manual updating whenever a new consumption measurement is added, I will probably just use auto-entities twice. One to collect all consumption and then one to show their relative consumption (e.g. by area).
But I need to get auto-entities working with Sankey first. Not quite sure if it is supported or not. My first try yesterday failed.

?
But where is the “911W grid power consumption” coming from? It does not just “have” this value. You need to define it via entities, do you not? At least that is what I take from the instructions.
You have to define the first (parent) and the subsequent value sources.
So I need to tell the card what the total is before it can then split it into the shares of the consumers (which I also need to define).
It’s very neat, using it too for a few days already.
It supports either power (instant) or energy, so you could have a chart for the power being used at the moment, and one for the accumulated energy used during the day.
You need to define the entities, they will not get auto-calculated. However, that’s fairly simple to with template sensors.
If you have a grid entity, and individual measured loads, you can create a template sensor for the sum of all your individual measured loads, and another to show the ‘rest’ by subtracting the measured loads from the grid.
Yes, I am not a big fan of creating template sensors. They need maintenance.
I prefer using wildcards and filters to have them created by the cards on the fly. Why create sensors when tools like auto-entities or the integration if those features into the cards could do it on-the-fly.
Plus, updates can brake manually created sensors.
Looks like auto-entities does not work with this card or I cannot figure out how to do it (sense you need multiple filters for the different levels).
Thanks @tom_l for the heads-up on the neat card.
After playing around with it and adding support for state-based colors, I came up with an entity dependency tree:

That’s a neat idea.
It has been a long time since i last installed a custom card. Can anyone tell me how you installed it?
I have added it to resources:
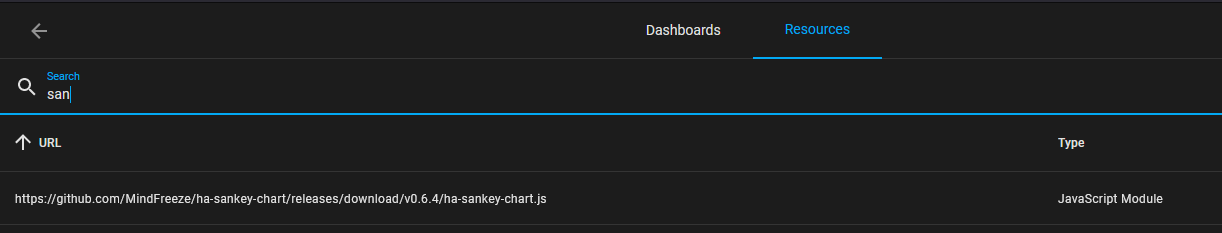
EDIT: Nevermind, i am a dumbass… i searched in HACS, but must have had a typo… it is in HACS… people, install it using HACS…
and i have added the first simple example:

and i have restarted. Any help would be appreciated.
cheers
Thanks for this excellent card, it looks great!
I started to prepare my power distribution based on it and already have few questions:
- Is it possible to skip section? E.g. to link parent in section 3 with child in section 5? I’d like to have all end devices aligned in the very last section, but some structure to reach to them migh have different number of sublevels, depending on complexity. For now if I place child object in non consecutive section it diplsys there, but there is no connection drwn to parent.
- Is it possible to have dynamic height of the card, e.g. something like 80% of entire page view? Would be very useful while using in panel view…
Here is sample of what I managed to achieve so far with this card:

BTW. Ground Floor Equipment Power and IT Rack Power are examples of entities, I’d like to skip section and move them more to the right.
I have just done thr same, though not as comprehensive… I too would like the height in percent.
Also, how did get it across the entire width? I assume it is by setting the tab to be a panel? Which means it is the only thing on the page.
Ta
Not yet. There’s a feature request open for it: https://github.com/MindFreeze/ha-sankey-chart/issues/9
Pixels only at the moment:
![]()
You could request it.

good idea:
I started using it and are OK with using current sensors like power or utility sensors like daily energy etc.
However I completely fail to get data on previous day energy represented.
So far I build the utility sensors manually like
 hourly_energy:
    source: sensor.grid_strom_energie
    name: Stündlicher Strombezug kWh
    cycle: hourly
  daily_energy:
    source: sensor.grid_strom_energie
    name: Täglicher Strombezug kWh
    cycle: daily
  monthly_energy:
    source: sensor.grid_strom_energie
    name: Monatlicher Strombezug kWh
    cycle: monthly
  yearly_energy:
    source: sensor.grid_strom_energie
    name: Jährlicher Strombezug kWh
    cycle: yearly
and referred to e.g. the daily version thereof which gives me the data for today-up-to-now.
But what I really want is to show e.g. yesterdays data. Is this something that I can achieve somehow?
I would be glad for some advise.
Can anyone spot what I’m doing wrong? I’m not getting any branches being drawn. I’ve been playing around with different settings and so far not a single branch has been drawn.
I thought maybe it was the theme I’m using (Metrology by Madelena) but she also uses the Sankey chart, so I doubt that’s it. Plus, I tried swapping the theme for this particular dashboard with no change in behavior.

type: custom:sankey-chart
title: Power
show_names: true
sections:
  - entities:
      - entity_id: sensor.breaker_panel_power_meter
        name: Total Power
        children:
          - entity_id: sensor.pool_pump_power_meter
          - entity_id: sensor.washing_machine_power_meter_meter
        remaining:
          name: Other
  - entities:
      - entity_id: sensor.pool_pump_power_meter
      - entity_id: sensor.washing_machine_power_meter
        children:
          - entity_id: sensor.idrac_host1_powerconsumption
          - entity_id: sensor.idrac_host2_powerconsumption
          - entity_id: sensor.idrac_host3_powerconsumption
        remaining:
          name: Other
  - entities:
      - entity_id: sensor.idrac_host1_powerconsumption
      - entity_id: sensor.idrac_host2_powerconsumption
      - entity_id: sensor.idrac_host3_powerconsumption
Code seems OK. However I see huge disrepancy in values you try to connect. E.g. Total Power is 76kW, while Network Rack Power is only 41W. I guess the line is drawn, but is so tiny that cannot be spotted Try to add some more contrasting to background color for entities (white?) perhaps somthing will become visible. You can also add at the top level min_box_height: 20 (or any other value) to force minimum height of the entity box in pixels. This also enforces width of the line at the child end, so perhaps something will start to be visible.