Correct, you don’t
1 Like
on the last update with the sort, is this what we’re supposed to do:
  - entities:
      - entity_id: sensor.alle_lampen_daily
        color: gold
      - entity_id: sensor.patchboard_zolder_daily
      - entity_id: sensor.inductieplaat_keuken_daily
      - entity_id: sensor.switches_daily_energy #sensor.switches_totaal_energy_daily
        color: skyblue
        sort_by: state # <-- here?
        children:
move it to the left a bit. On the same level as entities:
I must be getting dense here, but I tried that, and its doing nothing:
  - sort_by: state
    entities:
      - entity_id: sensor.alle_lampen_daily
        color: gold
      - entity_id: sensor.patchboard_zolder_daily
      - entity_id: sensor.inductieplaat_keuken_daily
      - entity_id: sensor.switches_daily_energy #sensor.switches_totaal_energy_daily
        color: skyblue
        children:
          - sensor.boiler_bijkeuken_daily
          - sensor.wasdroger_bijkeuken_daily
really sorry…
edit
found it… it was the entities section for the children…
  - sort_by: state
    entities:
      - entity_id: sensor.boiler_bijkeuken_daily
        name: Boiler
      - entity_id: sensor.wasdroger_bijkeuken_daily
        name: Wasdroger

now lets see what happens when I also sort the column to the left of that…

cool!
1 Like
Hi Tom,
I came across this post after starting to to work with the Sankey card. I noticed the beautiful cards underneath the Sankey cards and was wondering which card you used to make these beautiful graphs with extra info as well. Is it possible to share the card/type and code by which you created is this so I can modify this to my own sensors and liking? It looks so elegant, you did a good job making these!!
Kind Regards
That’s ‘custom:mini-graph-card’ and from the look of things it’s pretty much in default configuration except he’s also showing the min/max/average. Those are true/false selections. It’s a powerful little card.
Right, thanks a lot, I’ll dive in that card as well!
(Sorry if this is the wrong place and I should start a new topic but…)
I’m very new to Home Assistant and also to the Sankey Chart card but it is proving to be exactly what I am looking for to monitor my solar/battery home system. However I get soome funny displays at time wit the Sankey Chart card:

The code for the card is:
type: custom:sankey-chart
show_names: true
wide: true
min_box_distance: 10
sections:
- entities:
- entity_id: sensor.pv_power
color: ‘#00A000’
children:- sensor.house_consumption
- sensor.grid_export
- sensor.battery_charge
- entity_id: sensor.grid_import
color: ‘#F00C0C’
children:- sensor.house_consumption
- entity_id: sensor.pv_power
- entities:
- entity_id: sensor.battery_state_of_charge
- entity_id: sensor.battery_charge
color: ‘#70a050’ - entity_id: sensor.battery_discharge
color: ‘#FFFF00’
children:- sensor.house_consumption
- entities:
- entity_id: sensor.house_consumption
- entity_id: sensor.grid_export
color: ‘#F5880C’
(For some reason the forum has changed the dashes to black and white dots in the preview)
The issues I can see are:
- when I import from the grid (the red bit down the bottom on the left) it curves down (off the chart) but never comes back up to link to the house consumption (blue om the right
- the battery is supposed to be in the middle (so it can be charged from the panel and discharge into the house) but it seems to get lost and/or shifted vertically.
The display I am aiming for is to have the solar cells go directly to the house, the battery and the grid export (which is the order the inverter should send the energy). The grid import goes only to the house. The battery discharge goes to the house only.
Any idea what I’m doing wrong?
Susa
Start by removing state of charge. It has bo business in this chart. Then move battery discharge to the first section with the other generators.
There is a bug in GitHub about the strangely rendered connectors that I haven’t found the time to look into but it may be ok once you configure it correctly.
Thanks for the information.
At the moment we are going through a very sunny spell (middle of our summer here) and I’m vary rarely pulling power in from the grid so it might be a few days before I can tell if the changes have made a difference.
Just for my education: my reasoning for the layout was:
- the primary sources of power are the PV cells and the grid so these are the first section
- the battery is powered by the PV cells so that goes into the next section
- the main consumers are the house and the export to the grid so these are the 3rd section
This makes the flow always ‘left to right’, with the power from the PV cells going through the battery (charging) and on to the house (discharging) when there is enough power from the cells to do so.
Why is this (putting the battery in the middle) not the way to go? Is this that I don;t properly understand the ‘flow’ required for the Sankey diagrams?
Susan
The card doesn’t support different values for input and output yet. You have 2 entities for the battery for that but if you want the battery in the middle they have to be 1 with different values for either direction. Something like this is planned in issue #8 in GitHub.
You can put input and output in the middle as separate entities but they would not be connected in any way and the flow may be split into 2 parts. You will also have to be very careful about the vertical order of everything because the card doesn’t know exactly how much goes where (again #8) and tries to guess.
Hi guys,
I’m trying to use remaining_child_state but it seems it just isn’t showing up. Remaining parent state always works for me but this is the first time I’ve had a need for it.

In this example, I’ve a forecast solar of 0 (it’s night). The street lights are producing 0.1W supposedly (I think my circuitry actually has a leak somewhere but let’s not worry about that). My Pi is using 1W. So I would expect to see a remaining child power of 0.9W labelled as battery discharging.
Have I got my code wrong or should I be opening an issue?
type: custom:sankey-chart
height: 200
show_names: true
show_icons: true
min_box_height: 28
min_box_width: 28
wide: true
sections:
  - entities:
      - entity_id: sensor.power_production_now
        name: Forecast
        color: beige
        children:
          - sensor.prism_power_1
  - entities:
      - entity_id: sensor.prism_power_1
        name: Solar Panel
        color: yellow
        children:
          - sensor.prism_power_3
          - charge
      - entity_id: discharge
        type: remaining_child_state
        name: Discharging
        color: orange
  - entities:
      - entity_id: sensor.prism_power_3
        name: Raspberry Pi
      - entity_id: charge
        type: remaining_parent_state
        name: Battery Charging
        color: yellow
P.S. is it possible to set certain entities to show up even when zero?
remaining_child_state needs children configured and it must be in a section before these children.
0 state is not rendered.
Oh I see! So I need to add the same children that are in my Solar Panel to the child state! Thank you, I’ll give that a go. It was the only thing in the docs that didn’t have an example. I may create a PR to add an example if this works out 
1 Like
Thank you @MindFreeze, that’s it working nicely now. Here’s code for anyone else struggling with this.
I appreciate it was intended as a debug entity but I think this shows a really useful use case for it as now I can see not only when my battery is being used at night and by how much, but also I can quickly see the difference between how much I’m capturing on solar compared to the solar.forecast integration’s prediction
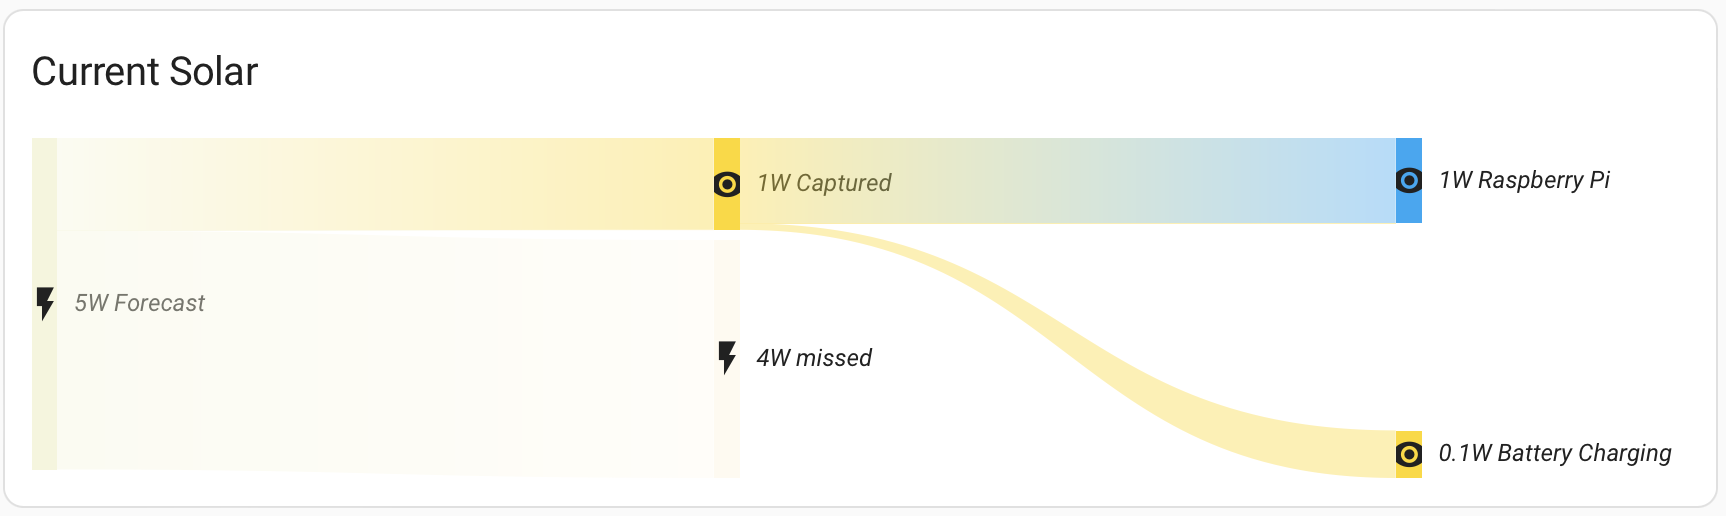

(second screenshot doesn’t reflect the colours I’ve used in the yaml below, in case anyone was wondering:)
title: Current Solar
type: custom:sankey-chart
show_names: true
show_icons: true
min_box_height: 28
min_box_width: 28
wide: true
sections:
  - entities:
      - entity_id: sensor.power_production_now
        name: Forecast
        color: beige
        children:
          - sensor.prism_power_1
          - loss
  - entities:
      - entity_id: sensor.prism_power_1
        name: Captured
        color: gold
        children:
          - sensor.prism_power_3
          - charge
      - entity_id: discharge
        type: remaining_child_state
        name: Discharging
        color: tan
        children:
          - sensor.prism_power_3
      - entity_id: loss
        type: remaining_parent_state
        name: missed
        color: floralwhite
  - entities:
      - entity_id: sensor.prism_power_3
        name: Raspberry Pi
      - entity_id: charge
        type: remaining_parent_state
        name: Battery Charging
        color: gold
Hello
I just found this beautiful card.
But have problems trying to bootstrap with it.
I’ve created empty dashboard.
I’ve added Sankey card alone with some energy sensors. The sensors are used by HA energy dasboard so I assume everything is good with them.
type: custom:sankey-chart
show_names: true
wide: true
unit_prefix: k
energy_date_selection: true
sections:
  - entities:
      - entity_id: sensor.total_electric_consumption
        children:
          - sensor.pg_lights_mainhouse_energy
          - sensor.oven_energy
          - sensor.dishwasher_power_consumption
          - sensor.network_components_power_consumption
          - sensor.pc_socket_2_energy_consumption
          - sensor.washing_machine_power_consumption
          - sensor.boiler_electric_consumption
          - sensor.fridge_consumption
          - sensor.tv_power_consumption
          - sensor.pg_socket_bedroom_energy
          - house_other_energy
  - entities:
      - sensor.pg_lights_mainhouse_energy
      - sensor.oven_energy
      - sensor.dishwasher_power_consumption
      - sensor.network_components_power_consumption
      - sensor.pc_socket_2_energy_consumption
      - sensor.washing_machine_power_consumption
      - sensor.boiler_electric_consumption
      - sensor.fridge_consumption
      - sensor.tv_power_consumption
      - sensor.pg_socket_bedroom_energy
      - entity_id: house_other_energy
        type: remaining_parent_state
        name: Other Energy
I’ve added them to Sankey. There are some values shown but doesn’t correspond to anything I could have in mind.

But it’s a good start.
Then I’ve read I have to have energy date picker.
I’ve added it to the view, but after setting the Sankey card to use energy_date_selection it takes some time to render and ends with error: No energy data received

Other issue I have with autoconfig option. If I enable it (using exact example from Sankey GIT) I’ve got following error:

pcroom is probably one of my areas. But I don’t use them. From time to time I assign an area to an entity, but it’s not something I use on regular basis.
I also found that sort_by option doesn’t work. Wherever I put it (I know it’s the option of sections) it either generates an error or does nothing. Probably my fault, but there is no usage example in the docs.
Maybe my example can help:
type: horizontal-stack
cards:
  - card_mod:
      style: |
        ha-card {
          text-align: center;
        }
    energy_date_selection: true
    height: 200
    min_box_distance: 5
    min_box_height: 3
    round: 1
    sections:
      - entities:
          - add_entities:
              - sensor.dsmr_reading_electricity_delivered_1
            children:
              - total
            color: purple
            entity_id: sensor.dsmr_reading_electricity_delivered_1
            name: Laagverbruik
            substract_entities:
              - sensor.dsmr_reading_electricity_delivered_2
            type: entity
          - add_entities:
              - sensor.dsmr_reading_electricity_delivered_2
            children:
              - total
            color: var(--warning-color)
            entity_id: sensor.dsmr_reading_electricity_delivered_2
            name: Hoogverbruik
            substract_entities:
              - sensor.dsmr_reading_electricity_delivered_1
            type: entity
      - entities:
          - children:
              - keuken
              - washok
              - woonkamer
              - meterkast
              - slaapkamer
              - jpt
              - jcl_kamer
              - Verlichting
              - unknown
            color: var(--warning-color)
            entity_id: total
            name: Totaal verbruik
            type: remaining_parent_state
      - entities:
          - children:
              - sensor.keuken_powerplug_vaatwasser_energy
              - sensor.koelkast_energy
            entity_id: keuken
            name: Keuken
            type: remaining_child_state
          - children:
              - sensor.washok_powerplug_wasmachine_energy
              - sensor.washok_powerplug_wasdroger_energy
            entity_id: washok
            name: Washok
            type: remaining_child_state
          - children:
              - sensor.serverruimte_energy
            entity_id: meterkast
            name: Meterkast
            type: remaining_child_state
          - children:
              - sensor.jpt_pc_verbruik_energy
            entity_id: jpt
            name: JPT Kamer
            type: remaining_child_state
          - children:
              - sensor.jcl_pc_verbruik_energy
            entity_id: jcl_kamer
            name: JCL Kamer
            type: remaining_child_state
          - children:
              - sensor.jl_pc_verbruik_energy
              - sensor.woonkamer_powerplug_tvmeubel_energy
              - sensor.woonkamer_powerplug_bank_energy
            entity_id: woonkamer
            name: Woonkamer
            type: remaining_child_state
          - children:
              - sensor.slaapkamer_powerplug_tv_energy
            entity_id: slaapkamer
            name: Slaapkamer
            type: remaining_child_state
          - children:
              - sensor.verlichting_energy
            entity_id: Verlichting
            name: Verlichting
            type: remaining_child_state
          - children: []
            color: grey
            entity_id: unknown
            name: Overig
            type: remaining_parent_state
        sort_by: state
      - entities:
          - children: []
            color: green
            entity_id: sensor.keuken_powerplug_vaatwasser_energy
            type: entity
          - children: []
            color: green
            entity_id: sensor.koelkast_energy
            type: entity
          - children: []
            color: green
            entity_id: sensor.washok_powerplug_wasmachine_energy
            type: entity
          - children: []
            color: green
            entity_id: sensor.washok_powerplug_wasdroger_energy
            type: entity
          - children: []
            entity_id: sensor.serverruimte_energy
            type: entity
          - children: []
            entity_id: sensor.jpt_pc_verbruik_energy
            type: entity
          - children: []
            entity_id: sensor.jcl_pc_verbruik_energy
            type: entity
          - children: []
            entity_id: sensor.jl_pc_verbruik_energy
            type: entity
          - children: []
            entity_id: sensor.woonkamer_powerplug_bank_energy
            type: entity
          - children: []
            color: yellow
            entity_id: sensor.woonkamer_powerplug_tvmeubel_energy
            type: entity
          - children: []
            color: yellow
            entity_id: sensor.slaapkamer_powerplug_tv_energy
            type: entity
          - children: []
            color: orange
            entity_id: sensor.verlichting_energy
            type: entity
        sort_by: state
    show_names: true
    show_states: true
    show_units: true
    type: custom:sankey-chart
    unit_prefix: k
    wide: true

1 Like
Not sure what should I look at.
Today morning I figure out, my example (see above) shows the current values stored in sensors. Those are cumulative values.
I suspect, that it is expected without an energy date picker.
When enabled the picker, several errors like below appear in the dev console:

It seems I should file an issue in github
Edit: seems somebody have already reported this issue: No energy data received · Issue #84 · MindFreeze/ha-sankey-chart · GitHub
Hello,
I have created a live power usage chart with this amazing component. Is it possible to “hide” entities that are on standby, like all below 1W?
2 Likes