Hi all,
I’ve recently started using Home Assistant so I’m pretty new.
I have added my mqtt smart plugs, templates and added a dashboard to my lovelace in configuration.yaml to show Energy Consumption:
template: !include templates.yaml
mqtt: !include mqtt.yaml

lovelace:
  mode: storage
  dashboards:
    lovelace-energy-consumption:
      mode: yaml
      title: Energy Consumption
      icon: mdi:chart-gantt
      show_in_sidebar: true
      filename: db-energy-consumption.yaml
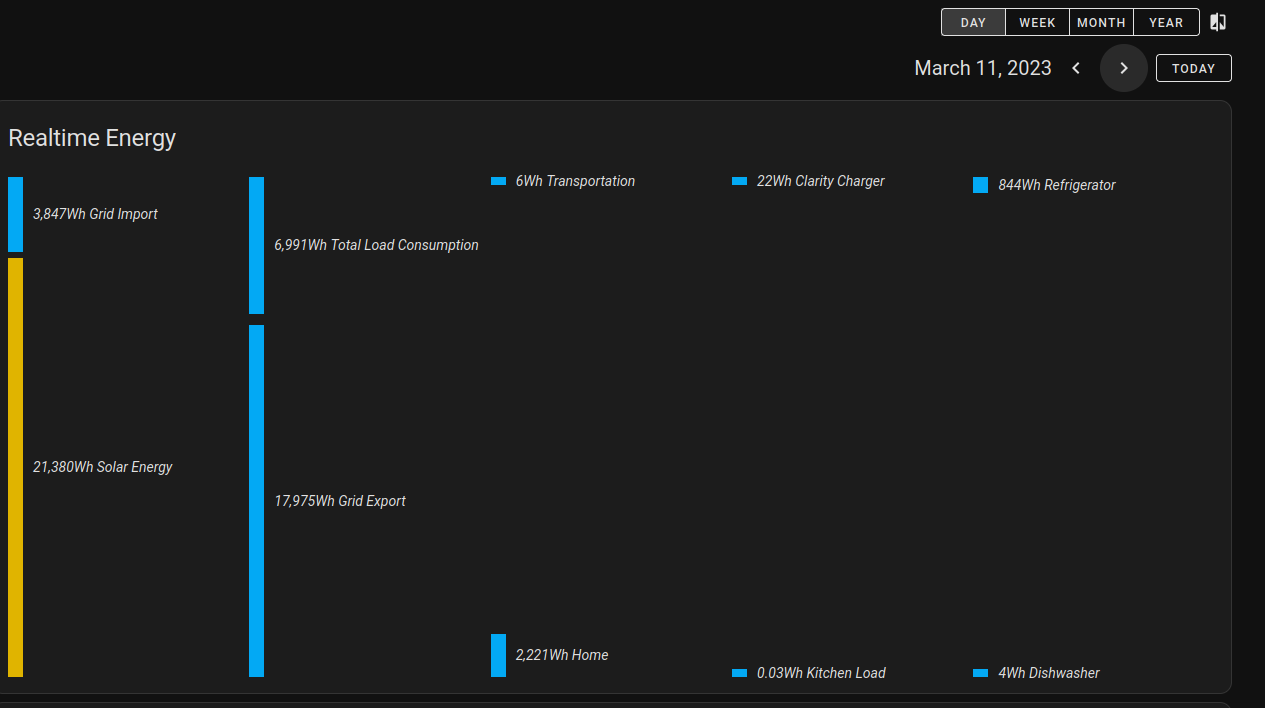
The end result is:

However, I would like monitored loads to be a column to the right, so they’ll become bigger and better readable. I tried to do things with passthrough, but to no avail. I thought I might need a template sensor that would be the sum of those monitored loads, which is why I created the following templates.yaml:
- sensor:
    - unique_id: monitored_loads
      name: monitored_loads
      unit_of_measurement: "kWh"
      state_class: measurement
      device_class: energy
      state: >
          {% set variable = namespace(value = {}) %}
          {% set power = namespace(value = 0) %}
          {% for entity in states.sensor if (entity.entity_id.endswith("_consumption")) %}
            {% set variable.value = dict(variable.value, **{entity.name: entity.state }) %}
            {% set power.value = power.value |float + entity.state |float %}
          {% endfor %}
          {{ (power.value) |round(2) }}
I got the code from a youtube video and changed it to my need. I have a feeling it’s way more complicated than necessary, but I can confirm the monitored_loads sensor looks good when I view it. One thing that occurred to me was that the monitored_loads did not have a state attribute. It would just show “monitored_loads” when hovering the graph.
I’m reading my plugs with the following mqtt sensors:
  - unique_id: "server_room_consumption"
    name: "Server Room Consumption"
    state_topic: zigbee2mqtt/server_room
    device_class: "energy"
    state_class: "total_increasing"
    value_template: '{{ value_json.energy }}'
    unit_of_measurement: "kWh"

... etcetera...
Unfortunately I can’t get the monitored_loads to show up on the page. I just added it for now next to the smart plugs just to get it show on the chart, but it doesn’t. I think it may have something to do with the fact that all *_consumption sensors have a state with a float value and this template sensor does not. I also notice that those *_consumption sensors immediately show their graphs when I go to sensor info, while the template only shows a graph when I hit “Show more”. The dashboard db-energy-consumption.yaml:
views:
- cards:
- type: energy-date-selection
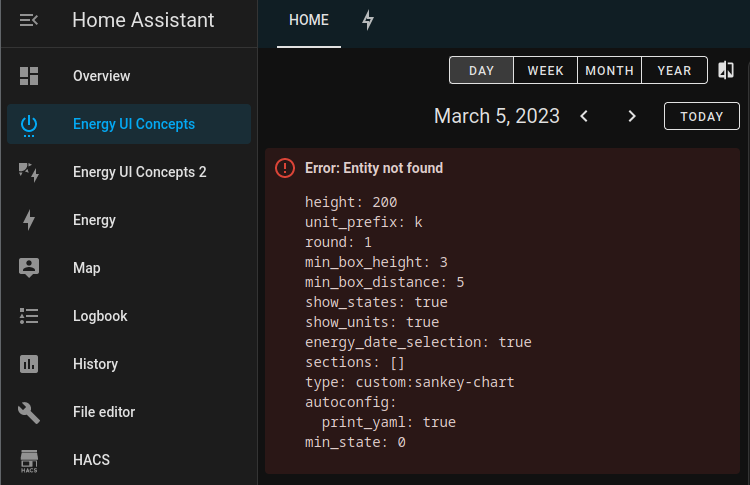
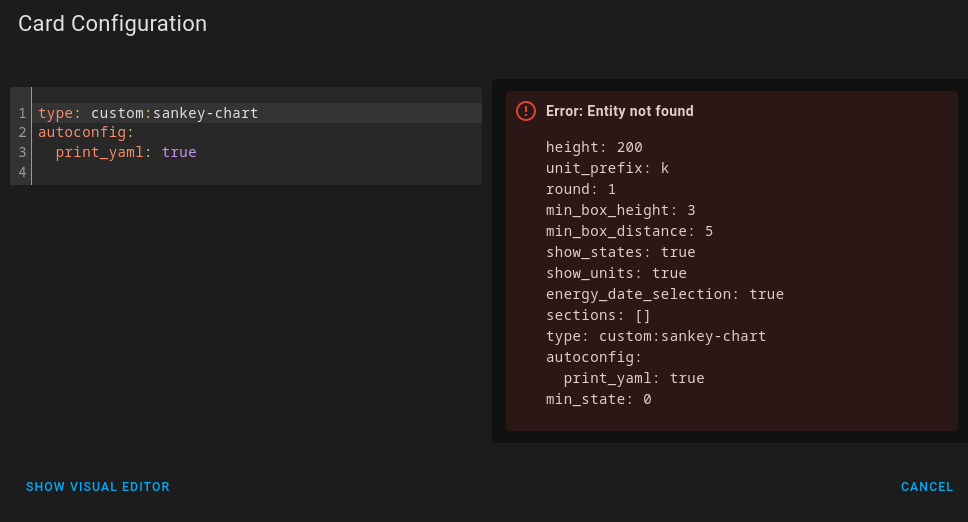
- type: custom:sankey-chart
show_names: true
height: 200
unit_prefix: k
wide: true
round: 2
min_box_height: 3
min_box_distance: 5
show_states: true
show_units: true
energy_date_selection: true
sections:
- entities:
- entity_id: sensor.solaredge_lifetime_energy
name: Solar
type: entity
color: 'rgb(225 180 1)'
children:
- sensor.p1_meter_3c39e72e77d4_total_power_export_t1
- total
- entity_id: sensor.p1_meter_3c39e72e77d4_total_power_import_t1
name: Grid
type: entity
color: 'rgb(229 93 102)'
add_entities:
- sensor.p1_meter_3c39e72e77d4_total_power_import_t2
children:
- sensor.p1_meter_3c39e72e77d4_total_power_export_t1
- total
- entities:
- entity_id: sensor.p1_meter_3c39e72e77d4_total_power_export_t1
name: "To Grid"
type: entity
color: 'rgb(13 160 53)'
add_entities:
- sensor.p1_meter_3c39e72e77d4_total_power_export_t2
children: []
- entity_id: total
type: remaining_parent_state
name: Total Consumed
color: 'rgb(255 127 4)'
children:
- unmonitored_loads
- sensor.monitored_loads
- sensor.garden_light_consumption
- sensor.desktop_consumption
- sensor.bed_heater_consumption
- sensor.freezer_small_consumption
- sensor.server_room_consumption
- sensor.work_consumption
- entities:
- entity_id: sensor.monitored_loads
name: Monitored Loads
type: entity
attribute: monitored_loads
color: 'rgb(58 103 158)'
- entity_id: sensor.garden_light_consumption
name: Garden Light
type: entity
color: 'rgb(58 103 158)'
- entity_id: sensor.desktop_consumption
name: Desktop
color: 'rgb(58 103 158)'
- entity_id: sensor.bed_heater_consumption
name: Bed Heater
color: 'rgb(58 103 158)'
- entity_id: sensor.freezer_small_consumption
name: Freezer
color: 'rgb(58 103 158)'
- entity_id: sensor.server_room_consumption
name: Server Room
color: 'rgb(58 103 158)'
- entity_id: sensor.work_consumption
name: Work Setup
color: 'rgb(58 103 158)'
- entity_id: unmonitored_loads
type: remaining_parent_state
name: Unmonitored Loads
children: []
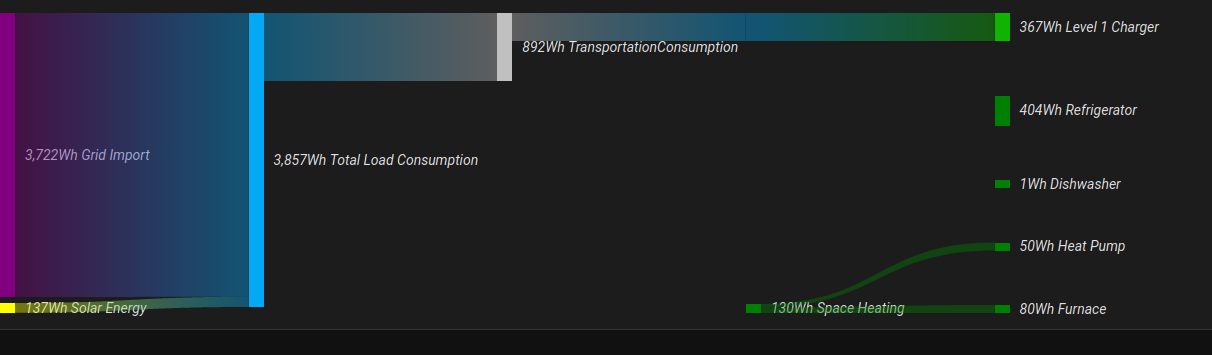
To recap, I want all monitored loads to have their own aggregated section, like a passhtrough section seen on other graphs here and have the monitored loads to be better visible on the right so they can make use of the entire height of the chart.
Other things I’ve been trying to do but fail miserably, is have the chart at 100% width like the very nice screenshots in this topic.
Last thing: If anybody can tell me or reference me to documentation on how to template yaml itself, that would be great. I’ve been repeating myself a lot in the configuration and I think you can do something like <<: to reuse predefined yaml sections. I have had some success on yaml lint, but HA wouldn’t accept it as valid because it thought my predefined block was an unknown integration (iirc).
I greatly appreciate any advice you guys have! Been toying with this until 4am