ApexCharts card - A highly customizable graph card

Hi all - I am trying to use statistics to graph energy use by week. I have a sensor for this and it is producing long term statistics.

I notice that ApexCharts can pull statistics by 5minute, hour , day or month

But there does not seem to be support for ‘week’ as a time bucket. If I use the built-in statistics graph card there is an option to group by week.

Is this a planned feature for ApexCharts and/or is there a way to achieve this another way?

On a simple line graph depicting a thermostat’s temperature values (yaxis) against time (xaxis), I’m trying to add the active thermostat preset mode (e.g. wake, sleep, away) temperature ranges. Here is the configuration I’m currently using:

    - entity: sensor.downstairs_current_hvac_activity
      name: Away
      type: area
      curve: stepline
      color: gray
      stroke_width: 0
      opacity: 0.25
      transform: 'return x === ''away'' ? 80 : 50;'
      show:
        in_header: false
        legend_value: false

The problem is that the area below the preset’s minimum temperature and when that preset mode is inactive (i.e. not the current preset) still depicts as filled in.

Is there a way to achieve an area graph with a min and max set to a predefined yaxis temperature range only when the transform evaluates to true?

Assign this serie to a second y axis, going from 0 to 1. There are several examples in this thread (for binary sensors for eg)

Figured it out… for anyone else wanting similar

apex_config:
  plotOptions:
    radialBar:
      dataLabels:
        name:
          show: true
          offsetY: 20
        value:
          show: true
          offsetY: -12
          fontSize: 26px
          fontWeight: 500
          color: '#348e41'
        total:
          show: true
          label: Cost per hour
          fontSize: 10.5px
          fontWeight: 200
          color: '#348e41'
          formatter: |
            EVAL:(w) => {
              return w.globals.series[2] + 'p';
            }

Where series[2] is the series number you wish to display. Note series numbering starts at zero so [2] shows the third series. To show total it’s seriesTotals

2 Likes

I want it to use the same axis (temperature) for each of the temperature ranges of the respective presets, but only when that preset is active (otherwise not displayed at all).

This screenshot roughly demonstrates the two areas I do not want filled in:

The colored areas on the right were my first attempt at the four presets, but you can see all of them appear “on” since all of them shade below their minimum values even when they’re “off.”

Essentially, I’m trying to get the constrained yaxis depiction available via annotations, but time bound to the binary state of each thermostat preset mode (of which only 1 of 4 can be active at a time).

@RomRider I was able to sort of get this working by playing around with color_threshold, but I couldn’t quite configure a hard transition for opacity, so I still have a gradient where I don’t want one. Are there guides on how to configure the thresholds?

    - entity: sensor.downstairs_current_hvac_activity
      name: Home
      type: area
      curve: stepline
      color: cadetblue
      color_threshold:
        - value: 74
          color: cadetblue
          opacity: 0.5
        - value: 72
          color: cadetblue
          opacity: 0
      stroke_width: 0
      transform: 'return x === ''home'' ? 74 : 68;'
      show:
        in_header: false
        legend_value: false

Thats really nice, thanks for sharing!

But I’m getting absurd values in the chart. using them to show power consumption in my house and the different phases (L1, L2, L3).

Correct power value is seen below (old layout of displaying this). Instead of 2,91 (or 3) it shows 19. And instead of Phase 1 of 11.1A it shows 56A :slight_smile:

Anything with the EVAL function that I need to adjust to my setup?

type: custom:apexcharts-card
chart_type: radialBar
header:
  title: ''
  show: true
  show_states: true
apex_config:
  plotOptions:
    radialBar:
      offsetY: 0
      startAngle: -130
      endAngle: 130
      hollow:
        size: 65%
      dataLabels:
        name:
          show: true
          offsetY: -10
        value:
          show: true
          offsetY: 0
          fontSize: 26px
          fontWeight: 500
          color: white
        total:
          show: true
          offsetY: 0
          label: Power consump.
          fontSize: 10.5px
          fontWeight: 200
          color: white
          formatter: |
            EVAL:(w) => {
              return Math.round(w.globals.series[0]) + 'kW';
            }
  legend:
    show: false
  chart:
    height: 200px
  stroke:
    lineCap: round
  fill:
    type: gradient
    gradient:
      type: vertical
      shadeIntensity: 0
      inverseColors: false
      opacityFrom: 1
      opacityTo: 0.9
      stops:
        - 1
        - 100
series:
  - entity: sensor.el_forbrukning_kw
    name: Elförbrukning
    color: rgba(240, 240, 240, 0.0)
    show:
      in_header: false
    min: 0
    max: 15
  - entity: sensor.nibe_105703_43084
    name: Eltillsats
    color: rgba(240, 240, 240, 0.0)
    show:
      in_header: false
    min: 0
    max: 6.5
style: |
  ha-card {
     --ha-card-background: rgba(0, 0, 0, 0);
     box-shadow: none;
     margin: 20px 0px 0px 0px;
     font-size: 15px;
     font-family: 'Segoe UI Light';
     text-align: center
   }
   div#header__title {
     font-size: 20px;
     font-weight: 300;
     font-family: 'Segoe UI Light";
     font-color: #ff0000
   }

1 Like

The value it shows will be a percentage of the bar that’s filled in. It works ok for mine without further calculations as I use a range of 0-1. You would have to further modify the eval function to calculate the true value.

Something like this might work:


formatter: |
  EVAL:(w) => {
    const scaledValue = Math.round((w.globals.series[0] / 100) * 15);
    return scaledValue + 'kW';
  }

1 Like
type: custom:config-template-card
entities:
  - sensor.ev_smart_charging_charging
  - input_select.grid_power_tariff_steps_limit_w
card:
  type: custom:apexcharts-card
  graph_span: 6d
  span:
    start: day
    offset: '-4d'
  update_interval: 1m
  show:
    last_updated: false
  now:
    show: true
    label: Now
  apex_config:
    annotations:
      yaxis:
        - 'y': ${states['input_select.grid_power_tariff_steps_limit_w'].state}
          y2: 15
          fillColor: '#cf6679'
          opacity: 0.2
          borderColor: '#cf6679'
          yAxisIndex: 0
          label:
            position: left
            offsetY: 720
            offsetX: 15
            textAnchor: start
            text: Grid tarrif limit
            borderColor: '#cf6679'
            style:
              color: '#fff'
              background: '#cf6679'
    tooltip:
      enabled: true
    grid:
      show: true
      strokeDashArray: 2
      position: back
    xaxis:
      tooltip:
        enabled: false
      axisBorder:
        show: false
    chart:
      height: 500px
      zoom:
        type: x
        enabled: true
        autoScaleYaxis: false
      toolbar:
        show: true
        autoSelected: zoom
      xaxis.type: datetime
    legend:
      show: false
  experimental:
    color_threshold: true
  yaxis:
    - id: price
      min: ~0
      max: ~1
      opposite: true
      apex_config:
        tickAmount: 10
        forceNiceScale: false
        decimalsInFloat: 2
        title:
          text: NOK/kWh
    - id: power
      min: 0
      max: 6
      opposite: false
      apex_config:
        tickAmount: 6
        forceNiceScale: false
        decimalsInFloat: 0
        title:
          text: kW
    - id: charge
      min: ~0
      max: ~0.1
      show: false
      opposite: true
      apex_config:
        tickAmount: 1
        forceNiceScale: false
        decimalsInFloat: 2
        title:
          text: kW
  series:
    - entity: sensor.kwh_meter_power_meter
      transform: return x / 1000
      extend_to: false
      name: Active Power
      yaxis_id: power
      float_precision: 3
      type: area
      stroke_width: 1
      opacity: 1
      color: '#3700b3'
      group_by:
        func: avg
        duration: 1h
    - entity: sensor.ev_smart_charging_charging
      yaxis_id: charge
      name: Charging Schedule
      data_generator: >
        return entity.attributes.charging_schedule.map((entry) => { return [new
        Date(entry.start), entry.value]; });
      type: area
      curve: stepline
      color: '#03dac6'
      stroke_width: 1
    - entity: sensor.no5_total_price
      name: Energy Price History
      extend_to: false
      yaxis_id: price
      type: line
      curve: stepline
      float_precision: 3
      stroke_width: 2
      color_threshold:
        - value: 0
          color: green
        - value: 0.8
          color: khaki
        - value: 1
          color: orange
        - value: 1.2
          color: orangered
        - value: 1.4
          color: red
    - entity: sensor.ev_smart_charging_charging
      yaxis_id: price
      name: Energy Price Future
      data_generator: >
        return entity.attributes.raw_two_days.map((entry) => { return [new
        Date(entry.start), entry.value]; });
      type: line
      curve: stepline
      float_precision: 3
      extend_to: false
      stroke_width: 2
      color_threshold:
        - value: 0
          color: green
        - value: 0.8
          color: khaki
        - value: 1
          color: orange
        - value: 1.2
          color: orangered
        - value: 1.4
          color: red
view_layout:
  grid-area: chart
1 Like

Can anyone help me with a simple change please?
I’ve been unable to center xlabels to value 0. and make the X axis (x=0) bolder than the other yaxis ticks.
Is that achievable?
My graphic goes from posiive to negative values.

Hello,

I have a problem with my graph, if I show the current day, the other days are shifted to the level of the date :

image

type: custom:apexcharts-card
graph_span: 7d
experimental:
  color_threshold: true
apex_config:
  legend:
    show: false
  stroke:
    width: 1
  xaxis:
    labels:
      hideOverlappingLabels: true
      showDuplicates: true
      show: true
  dataLabels:
    offsetY: -5
    background:
      enabled: true
    style:
      colors:
        - rgba(0,0,0,0.4)
  plotOptions:
    bar:
      borderRadius: 5
      dataLabels:
        position: top
header:
  show: true
  title: Électricité
  show_states: true
  standard_format: false
  colorize_states: true
yaxis:
  - id: first
    decimals: 0
    apex_config:
      tickAmount: 4
    min: ~0
  - id: second
    opposite: true
    decimals: 0
    apex_config:
      tickAmount: 4
    min: ~0
series:
  - entity: sensor.conso_jour
    offset: +0d
    yaxis_id: first
    type: column
    show:
      name_in_header: false
      datalabels: true
      legend_value: false
      header_color_threshold: true
    group_by:
      func: max
      duration: 1d
    opacity: 0.8
    float_precision: 2
    color_threshold:
      - value: 0
        color: rgb(176, 196, 222)
      - value: 5
        color: rgb(70, 130, 180)
      - value: 7
        color: orange
      - value: 10
        color: rgb(180, 70, 70)
      - value: 12
        color: firebrick
  - entity: sensor.electricite_cout_jour_avec_abo
    yaxis_id: second
    offset: +0day
    show:
      name_in_header: false
      datalabels: false
      legend_value: false
      header_color_threshold: true
    unit: €
    type: area
    curve: smooth
    fill_raw: last
    color: rgb(0,191,255)
    opacity: 0.2
    float_precision: 2
    name: Cout
    group_by:
      func: max
      duration: 1d

If I don’t show the current day, all it’s fine

I’m trying to track what time I go to bed every day. An automation enters an input_datetime which is what I’m trying to chart. The problem is that it only seems to recognize the hours of the timestamp and not the minutes.

This should say something like “17:45” and not 17.

image

type: custom:apexcharts-card
graph_span: 7d
span:
  end: isoWeek
apex_config:
  tooltip:
    x:
      format: ddd-dd
      decimals: 4
  y_axis_precision: 10
  chart:
    toolbar:
      show: true
  xaxis:
    type: datetime
    labels:
      format: ddd-dd
yaxis:
  - min: 12
    max: 24
    decimals: 4
    apex_config:
      tickAmount: 6
header:
  show: true
  title: ApexCharts-Card
  show_states: true
  colorize_states: true
series:
  - entity: input_datetime.sleep_time
    name: Time Went to Bed
    stroke_width: 3
    float_precision: 5
    show:
      extremas: true
    type: line
    group_by:
      func: last
      duration: 1h 

Is it possible to use the dates from the energy-date-selection card to set the span to show data for on the ApexCharts Card?

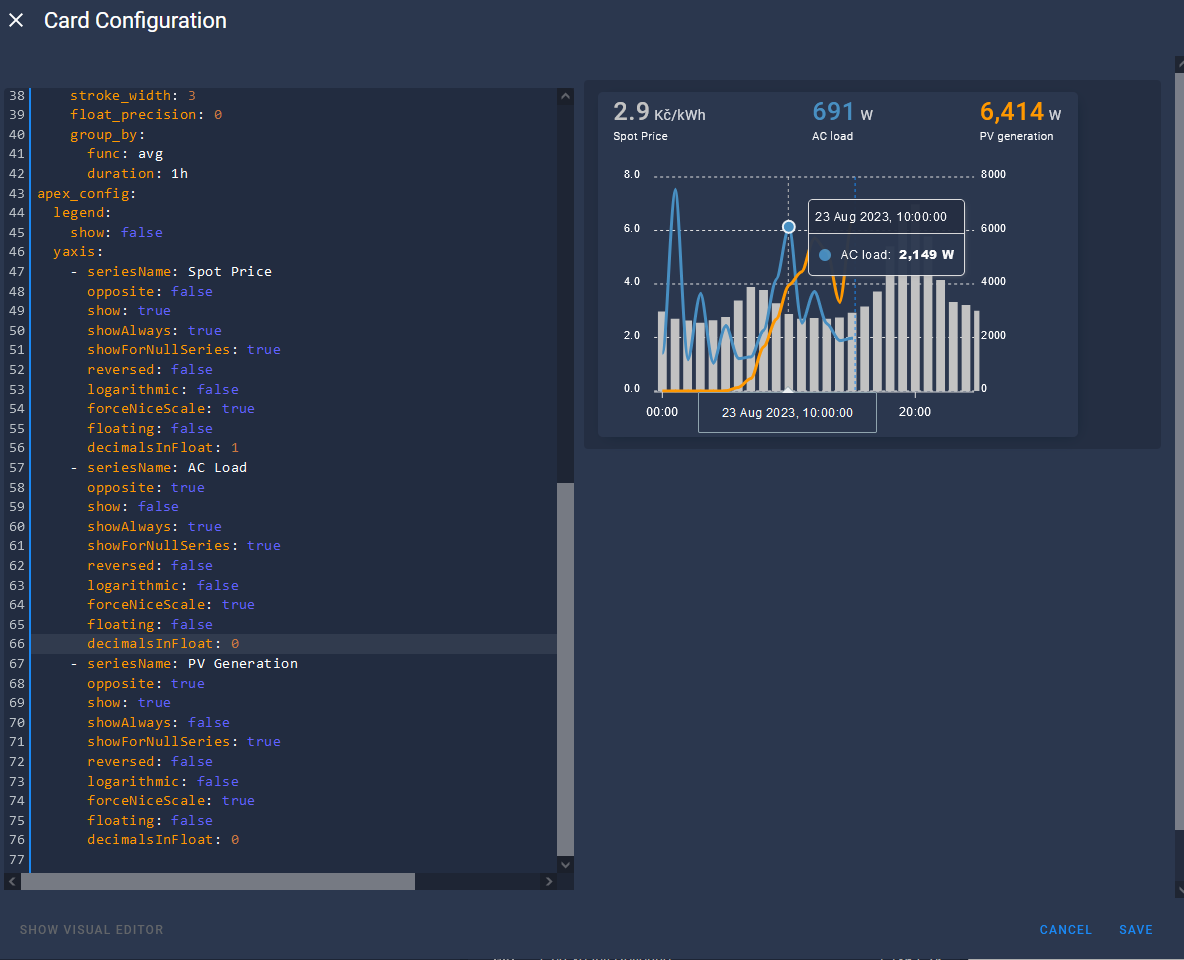
Hello, can anyone explain why the blue graph is not properly scaled? YAxis on right shows scale for orange graph which is OK, but blue graph is using different scale, basically it should be half.

Here on the screenshot the blue value is 2149W, but it is on 6000W line.

Hello all, I am comparing temp sensors now with yesterday by using an offset of 1d.
The header states are however ‘off’ which may be expected.
For ‘now’ it shows the current values
For the offset, it shows the value at the end of the span midnight last night)
Is there a way to make the header state of the offset show ‘now - offset’
image

Hi All,

I’m trying to create a graph, line or area, doesn’t matter which one.
Just plotting values,
When value gets 0 or below, line has to turn green (not fading to green, just instant green), above 0 it has to be orage.

any ideas how ?

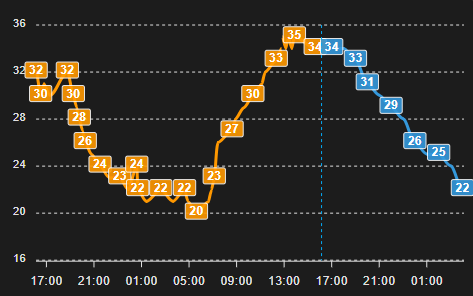
I’m plotting a temperature graph, with 2 series, 1 being the history of the past 24 hours of outside temperature and the 2nd being a forecast for the next 12 hours.
Now, if only I could add the condition (or perhaps precipitation) in a way to the datalabels, it would replace my hourly-weather card.

I can’t add this extra info to the series data, because that has to be a date+value pair list only. I know I can customize the datalabel formatter through the apex config, but I don’t seem to be able to access the entity there to somehow get access to the other details beside temperature. Is there any way to somehow reach this extra info in the datalabels?

type: custom:apexcharts-card
graph_span: 36h
now:
  show: true
span:
  start: minute
  offset: '-1d'
all_series_config:
  stroke_width: 3
  show:
    datalabels: true
apex_config:
  legend:
    show: false
  dataLabels:
    formatter: |
      EVAL:function(value, { seriesIndex, dataPointIndex, w }) {
        return value;
      }
series:
  - entity: sensor.idokep_temperature
    name: Hőmérséklet
    extend_to: false
  - entity: sensor.idokep_hourly_data
    name: Előrejelzés
    data_generator: |
      const data = [];
      for (let i = 1; i <= 13; i++) {
        data.push([new Date(entity.attributes[`hour${i}_date`]).getTime(), entity.attributes[`hour${i}_temperature`]])
      }
      return data;

image

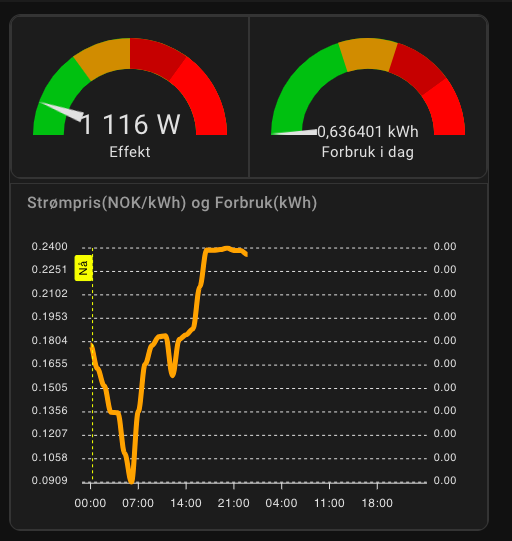
This card looks awesome and I have been spending some time trying to achieve what other has achieved. I have read more than 2000 posts on this page and my head cant take more for now. What I am trying to do is to show the energy price and the consumption and show the consumption by hour. Somehow I struggle with the consumption as it will not show the correct values. As I am a Tibber-user I got several sensors showing consumption. I got the accumulated consumption current hour, I got the accumulated consumption for the day, and I got the last meter values. I also have made a utility meter witch resets every hour, still the columns shows up very stange and far from correct. Can anyone tell me what to do? The code as it is for now is:

type: custom:apexcharts-card
update_interval: 1min
header:
  show: true
  title: Strømpris og Forbruk
  show_states: true
  colorize_states: true
graph_span: 2d
span:
  start: day
now:
  color: yellow
  label: Nå
  show: true
yaxis:
  - id: primary
    decimals: 4
  - id: secondary
    show: true
    decimals: 2
    opposite: true
series:
  - entity: sensor.energy_price_elsa_laulas_veg_20
    name: strømpris
    yaxis_id: primary
    type: line
    extend_to: end
    color: orange
    data_generator: >
      const rawToday = entity.attributes.raw_today; const rawTomorrow =
      entity.attributes.raw_tomorrow; const tomorrowValid =
      entity.attributes.tomorrow_valid;

      const allData = [];

      if (rawToday) {
        allData.push(...rawToday);
      }

      if (tomorrowValid) {
        allData.push(...rawTomorrow);
      }

      const generatedData = allData.map(entry => {
        const time = new Date(entry.time).getTime();
        const total = parseFloat(entry.total);
        return [time, total];
      });

      return generatedData;
  - entity: sensor.accumulated_consumption_hjemme
    name: forbruk time
    yaxis_id: secondary
    type: column
    statistics:
      type: sum
      period: hour
      align: middle
    group_by:
      func: delta
      duration: 1h
      start_with_last: true
    color: rgb(0, 154, 194)
    data_generator: |
      const now = new Date(); const data = []; for(let i = 0; i <= 24; i++) {
        data.push([now.getTime() - i * 1000 * 60 * 60, Math.floor((Math.random() * 10) + 1)])
      } return data.reverse();
apex_config:
  chart:
    zoom:
      enabled: true
  legend:
    show: false
  xaxis:
    type: datetime
    labels:
      format: HH:mm

EDIT: And a question, is it not possible to use this card in Dwains Dashboard.

I guess my data_generator which was the default one, just gave me random values. Changed the code to this:

type: custom:apexcharts-card
update_interval: 1min
header:
  show: true
  title: Strømpris og Forbruk
  show_states: true
  colorize_states: true
graph_span: 2d
span:
  start: day
now:
  color: yellow
  label: Nå
  show: true
yaxis:
  - id: primary
    decimals: 4
  - id: secondary
    show: true
    decimals: 2
    opposite: true
series:
  - entity: sensor.energy_price_elsa_laulas_veg_20
    name: strømpris
    yaxis_id: primary
    type: line
    extend_to: end
    color: orange
    data_generator: >
      const rawToday = entity.attributes.raw_today; const rawTomorrow =
      entity.attributes.raw_tomorrow; const tomorrowValid =
      entity.attributes.tomorrow_valid;

      const allData = [];

      if (rawToday) {
        allData.push(...rawToday);
      }

      if (tomorrowValid) {
        allData.push(...rawTomorrow);
      }

      const generatedData = allData.map(entry => {
        const time = new Date(entry.time).getTime();
        const total = parseFloat(entry.total);
        return [time, total];
      });

      return generatedData;
  - entity: sensor.accumulated_consumption_hjemme
    name: forbruk time
    yaxis_id: secondary
    type: column
    statistics:
      type: sum
      period: hour
      align: middle
    group_by:
      func: diff
      duration: 1h
      start_with_last: true
    color: rgb(0, 154, 194)
apex_config:
  chart:
    zoom:
      enabled: true
  legend:
    show: false
  xaxis:
    type: datetime
    labels:
      format: HH:mm

But it is still not possible to add the cards to dwains dashbboard :frowning:

EDIT: There is no problem in Dwains Dashboard as long as I wrap another card around it, like an vertical stack or something.

Hi there,

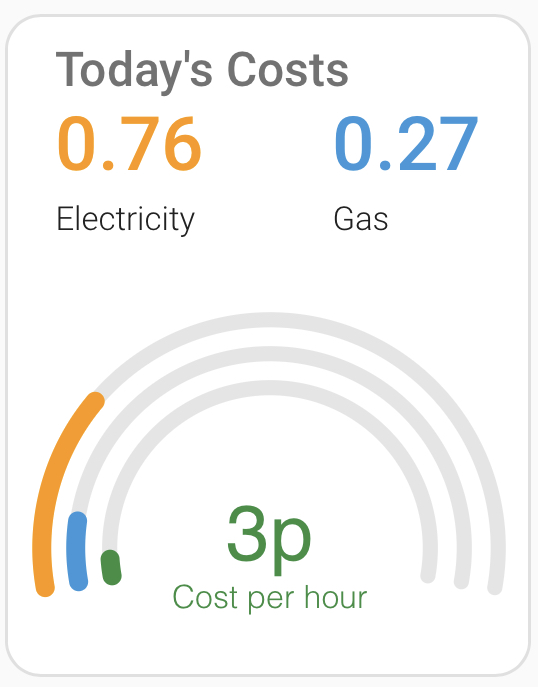
i am looking for a real nice solution for displaying a battery.
Is this possible with apexCharts too? or does someone have a better hint?
It is just a bargraph showing the charge-amount of a battery, but in “nice”.