Existing issue already in earlier HA versions and unless Romrider gets annoyed himself, I guess this will remain ![]()
a ok, I hadn’t seen that. Will close the HA issue then, there was no issue in the Apexcharts repo as far as I could tell.
Ive solved as explained there: keep it out of HACS< and add it to resources manually, and edit the toolbar to use z-index 1
  .apexcharts-toolbar {
    position: absolute;
    z-index: 1;
    max-width: 176px;
    text-align: right;
    border-radius: 3px;
    padding: 0px 6px 2px 6px;
    display: flex;
    justify-content: space-between;
    align-items: center;
    opacity: 0.5;
  }
problem solved (and no others introduced yet…)
That is likely because no one picks up on issues since quite a while and it is a tricky repo to step-in and take over from RR (with a fork). The above is a workaround, quite a nice one to see but in reality ‘horrible’ …i.e. if one has to stoop into this to get things working ![]() At least, thanks for a solution !
At least, thanks for a solution !
Well, horrible…
It’s the way we did things before HACS… I still have several cards loaded outside of Hacs because of specific edits.
And that edit: it’s what Jerome would have done in a PR himself probably, so no ‘hack’ or anything.
Possibly, but you have to think about the majority of users that want a straight-forward solution and not trickeries (sorry about the wording) that only advanced/experts know of. Anyhow, that is the risk of hacs-solutions, at some point one will loose the main driver ![]()
1 Like
Sure.
Otoh, if you want a straightforward solution, this card is not for you ![]()
I would think the fix is easier than the average apexcharts card config
LOL you are oh so right but still, then you need to document this too ![]()
Is there a way to make the max value read from a sensor value? It seems not to accept any jinja of js.
What is ‘it’, did you try something already?
From what I know, one can query the statistics (examples in this post above) but not sure if one can query regular history…also not sure what you mean with ‘max’ … max of what?
ok, valid questions
yaxis:
  - id: W
    decimals: 1
    min: 0
    max: |
      [[[
        return parseFloat(states['sensor.nordpool_global_max'].state);
      ]]]
and I have tried this too
max: {{ states('sensor.nordpool_global_max') | float }}
Both return a render error.
Templates will only work if you wrap it in the config-template card or card-templater…see other post in this thread. On the function, not sure anymore if I have seen extracting states from a entity before but you need to use EVAL (see documentation)… so likely (a lot) easier using the config-template
This is correct. min: and max: support the options listed in the documentation. I use the |+20| style which works pretty well without resorting to any template wrappers, keeping the complexity low.
Does anyone know what the status of the repository is? It seems to be abandonded by RomRIder? Is there a fork being actively worked on? I see so many issues being unanswered/go stale/automatically closed
Hi guys, i am having problem with statistics options:
today is 5th July, with the offset -1d and span of 5d, i am expecting the the value between 30 Jun - 4 July but why I am still seeing 5th July in the output?
I dont face the same issue with Group_by though.
# lovelace_gen

type: custom:apexcharts-card
header:
  show: true
  title: "test"
  show_states: true
  colorize_states: false
graph_span: 5d
span:
  end: day
  offset: -1d
apex_config:
  chart:
    width: 100%
    height: 100%
  tooltip:
    x:
      format: dd MMM
  xaxis:
    type: datetime
    labels:
      format: dd MMM
series:
  - entity: {{ chart_entity }}
    type: column
    # group_by:
    #   func: last #max
    #   duration: 1d
    statistics:
      type: state
      period: day
      align: start
    float_precision: 3
    show:
      extremas: true
      in_header: false
  - entity: {{ chart_header_entity }}
    show:
      in_chart: false
      name_in_header: false
    float_precision: 3

i solved the issue with a walkaround by reducing the span by 1 day and increase the negative offset by 1 day but i dont think this should be the actual solution ![]()
1 Like
Hi
Is it possible to plot a (horizontal) bar chart showing the current values of a bunch of temperature sensors? No time series, just the latest state.
It looks like it’s abandoned indeed.
Vingerha has one with some improvements (more like updates of the engine) which works for me (I mean: it doesn’t crash), but no other repo has taken over.
Thanks TheSerapher is working well now. My code is:
type: custom:config-template-card
entities:
  - input_number.limite_inferior_confort_suite
  - input_number.limite_superior_confort_suite
variables:
  limit_inf: states['input_number.limite_inferior_confort_suite'].state
  limit_sup: (states['input_number.limite_superior_confort_suite'].state) + 1
card:
  type: custom:apexcharts-card
  header:
    title: Ventilador versus Confort
    show: true
    show_states: true
  show:
    loading: true
  graph_span: 1d
  apex_config:
    annotations:
      position: back
      yaxis:
        - "y": ${limit_sup}
          strokeDashArray: 1
          borderColor: "#f80808"
          borderWidth: 3
        - "y": ${limit_inf}
          strokeDashArray: 1
          borderColor: "#f80808"
          borderWidth: 3
    yaxis:
      - id: first
        max: 30
        min: 20
        forceNiceScale: true
        decimalsInFloat: 0
        opposite: false
      - id: second
        max: 40
        min: 0
        forceNiceScale: true
        decimalsInFloat: 0
        opposite: true
    xaxis:
      axisBorder:
        show: false
      labels:
        style:
          fontSize: 10px
          fontFamily: Segoe UI Light
    chart:
      height: 240
    grid:
      show: true
      borderColor: "#858383"
      strokeDashArray: 3
      position: back
    legend:
      show: false
    dataLabels:
      enabled: true
  series:
    - entity: sensor.confort_termico_suite
      yaxis_id: first
      name: Confort Suite
      type: line
      color: 2eb9ff
      stroke_width: 2
      group_by:
        func: avg
        duration: 10sec
      float_precision: 1
      show:
        extremas: true
        in_brush: true
    - entity: sensor.porcentaje_vent_suite
      yaxis_id: second
      name: Velocidad Ventilador
      type: line
      color: 08f842
      stroke_width: 2
      group_by:
        func: avg
        duration: 10sec
      float_precision: 1
      show:
        extremas: true
        in_brush: true
  now:
    show: true
    label: now
  style: |
    ha-card {
       --ha-card-background: rgba(0, 0, 0, 0);
       box-shadow: none;
       margin: 8px 0px 28px 8px;
       font-size: 15px;
       font-family: Segoe UI Light;
     }
     div#header__title {
       font-size: 10px;
     }
And the graph is:
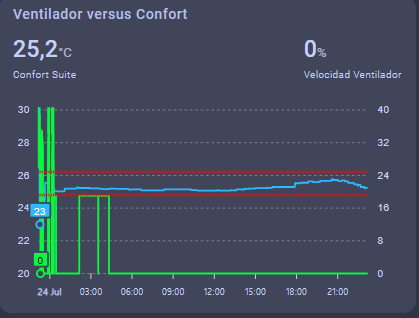
Thanks for your help
1 Like
You may be better off using this.
Thanks – I am using custom:bar-card currently, but it has just been removed from HACS. No updates for four years and now a gross problem with the decimal places in 2025.7.
Although, since you’ve made me look more, there is a maintained fork:
1 Like