ApexCharts card - A highly customizable graph card

Thank you for the incredible work on this card. I have a few challenges that I have yet to figure out:
image
History card has this nice ability to color fill the on off state of a heater within the bounds of the temperature displayed. This may not be possible to replicate? but I’d sure love to.

image
My implementation does the job. But I can’t find a way to exclude entities such as Power from taking up space in the tool tip (and by extension, perhaps help avoiding the problem below by excluding entities that aren’t reporting often enough?)

image
Getting the tooltip to remain grouped for more than one moment. A page refresh or click away and back will cause the data no no longer be aligned. I’ve tried all the tips in this thread such as:

          group_by:
            func: avg
            duration: 1min
            fill: last

I’ve tried different duration amounts, and all the suggestions I could find here including adding:

          tooltip:
            shared: true

As well as juggling these values into different spots and using different combinations of them.

image
Lastly, I would love to be able to customise the header so clicking it toggles graph content, much like the legend does on click. Being able to force Power to show it’s current state (heat or off) instead of the transformed values would also be amazing.

If someone has a solution or guidance on any of these obstacles, I would greatly appreciate it!

Hi,

I’m having a bit of trouble with a weather forecast that I did with much help from people on this thread. Everything is working well, except for the fact that my columns are very very narrow. I’ve noticed that removing the first temperature series solves the problem. I also have very weird behaviour: inverting the order of the series messes with the colors (e.g. if I put the precipitation first, then the columns have the color defined in the temp series and the areas have the color of the precipitation series).

Full code of the card:

  - type: 'custom:apexcharts-card'
    graph_span: 14d
    span:
      start: day
      offset: -7d
    now:
      show: true
      label: 'Présent'
      color: '#ff1a1a'
    yaxis:
      - id: temp
        show: true
        apex_config:
          forceNiceScale: true
          tickAmount: 5
          decimalsInFloat: 0
      - id: rain
        show: true
        opposite: true
        apex_config:
          forceNiceScale: true
          tickAmount: 5
          decimalsInFloat: 0
    apex_config:
      dataLabels:
        enabled: false
      chart:
        width: '100%'
        height: '100%'
      legend:
        position: top
        show: false
      grid:
        show: false
        padding:
          left: 5
          right: 20
      plotOptions:
        bar:
          columnWidth: '50%'
      xaxis:
        axisBorder:
          show: false
        axisTicks:
          show: false
        tooltip:
          enabled: false
    series:
      - entity: weather.openweathermap
        type: area
        color: '#ffa31a'
        opacity: 0.65
        name: 'Température'
        unit: °C
        attribute: temperature
        stroke_width: 0
        yaxis_id: temp
        fill_raw: last
        show:
          legend_value: false     
        group_by:
          func: avg
          duration: 1h 
        extend_to: now 
      - entity: weather.openweathermap
        type: area
        color: '#ffa31a'
        opacity: 0.65 
        stroke_width: 0
        yaxis_id: temp
        name: 'Température'
        unit: °C
        extend_to: now
        fill_raw: last
        show:
          legend_value: false
        data_generator: |
          return entity.attributes.forecast.flatMap((entry) => {
            let noon = new Date(entry.datetime).setHours(12, 0, 0, 0);
            let midnight = new Date(entry.datetime).setHours(24, 0, 0, 0);
            return [[new Date(noon).getTime(), entry.temperature], [new Date(midnight).getTime(), entry.templow]];
          });
      - entity: sensor.openweathermap_rain
        type: column
        yaxis_id: rain
        name: 'Précipitations'
        unit: mm
        color: '#0b0385'
        opacity: 0.65
        show:
          legend_value: false     
        group_by:
          func: sum
          duration: 1d
      - entity: weather.openweathermap
        type: column
        yaxis_id: rain
        color: '#0b0385'
        name: 'Précipitations'
        unit: mm
        opacity: 0.65
        show:
          legend_value: false
        data_generator: |
          return entity.attributes.forecast.map((entry) => {
            return [new Date(entry.datetime).setHours(24, 0, 0, 0), entry.precipitation];
          });
    card_mod:
      style: |
        :host {
          left: 50%;
          top: 75%;
          width: 90%;
          height: 40%;
        }
        ha-card {
          background: none !important;
          height: 100%;
        }
        .wrapper.with-header {
          height: 100%;
        }
        .apexcharts-tooltip {
          border: none !important;
          border-radius: 0.2vw !important;
        }
        .apexcharts-tooltip-title {
          border: none !important;
          padding-bottom: none;
          margin-bottom: none;
        }
        .apexcharts-xaxis-annotations > rect {
          display: none;
        }

The result:

Switching around the series:

series:
  - entity: sensor.openweathermap_rain
    type: column
    yaxis_id: rain
    name: Précipitations
    unit: mm
    color: '#0b0385'
    opacity: 0.65
    show:
      legend_value: false
    group_by:
      func: sum
      duration: 1d
  - entity: weather.openweathermap
    type: column
    yaxis_id: rain
    color: '#0b0385'
    name: Précipitations
    unit: mm
    opacity: 0.65
    show:
      legend_value: false
    data_generator: |
      return entity.attributes.forecast.map((entry) => {
        return [new Date(entry.datetime).setHours(24, 0, 0, 0), entry.precipitation];
      });
  - entity: weather.openweathermap
    type: area
    color: '#ffa31a'
    opacity: 0.65
    name: Température
    unit: °C
    attribute: temperature
    stroke_width: 0
    yaxis_id: temp
    fill_raw: last
    show:
      legend_value: false
    group_by:
      func: avg
      duration: 1h
    extend_to: now
  - entity: weather.openweathermap
    type: area
    color: '#ffa31a'
    opacity: 0.65
    stroke_width: 0
    yaxis_id: temp
    name: Température
    unit: °C
    extend_to: now
    fill_raw: last
    show:
      legend_value: false
    data_generator: |
      return entity.attributes.forecast.flatMap((entry) => {
        let noon = new Date(entry.datetime).setHours(12, 0, 0, 0);
        let midnight = new Date(entry.datetime).setHours(24, 0, 0, 0);
        return [[new Date(noon).getTime(), entry.temperature], [new Date(midnight).getTime(), entry.templow]];
      });

Yields this:

I’m very puzzled by this, any pointers are more than welcome.

Replying to myself.

I suspect it is a bug, submitted an issue:

Hi everyone,

I have missing value in my history. So I use the option : “fill_raw: last”. Like said in the doc : If there is any missing value in the history, last will replace them with the last non-empty state

It’s work fine but i have a new problem with this option, it creates me as a new entry at the beginning of the graph :

I would like to have a very clean dashboard. Does anyone have a solution/track to my problem?

Thank’s

3 Likes

I don’t have an answer to your question unfortunately but I would really love to see your code on that, looks amazing!

1 Like

me too! @ArnaultR that looks amazing!

Hi, what do you whant to see ? The code of the ApexGraph or the code of the entire card ?

If it’s the all card, I think i need to share it an other topic for not spam here. A screenshot of the entire card (dev in progress) :

3 Likes

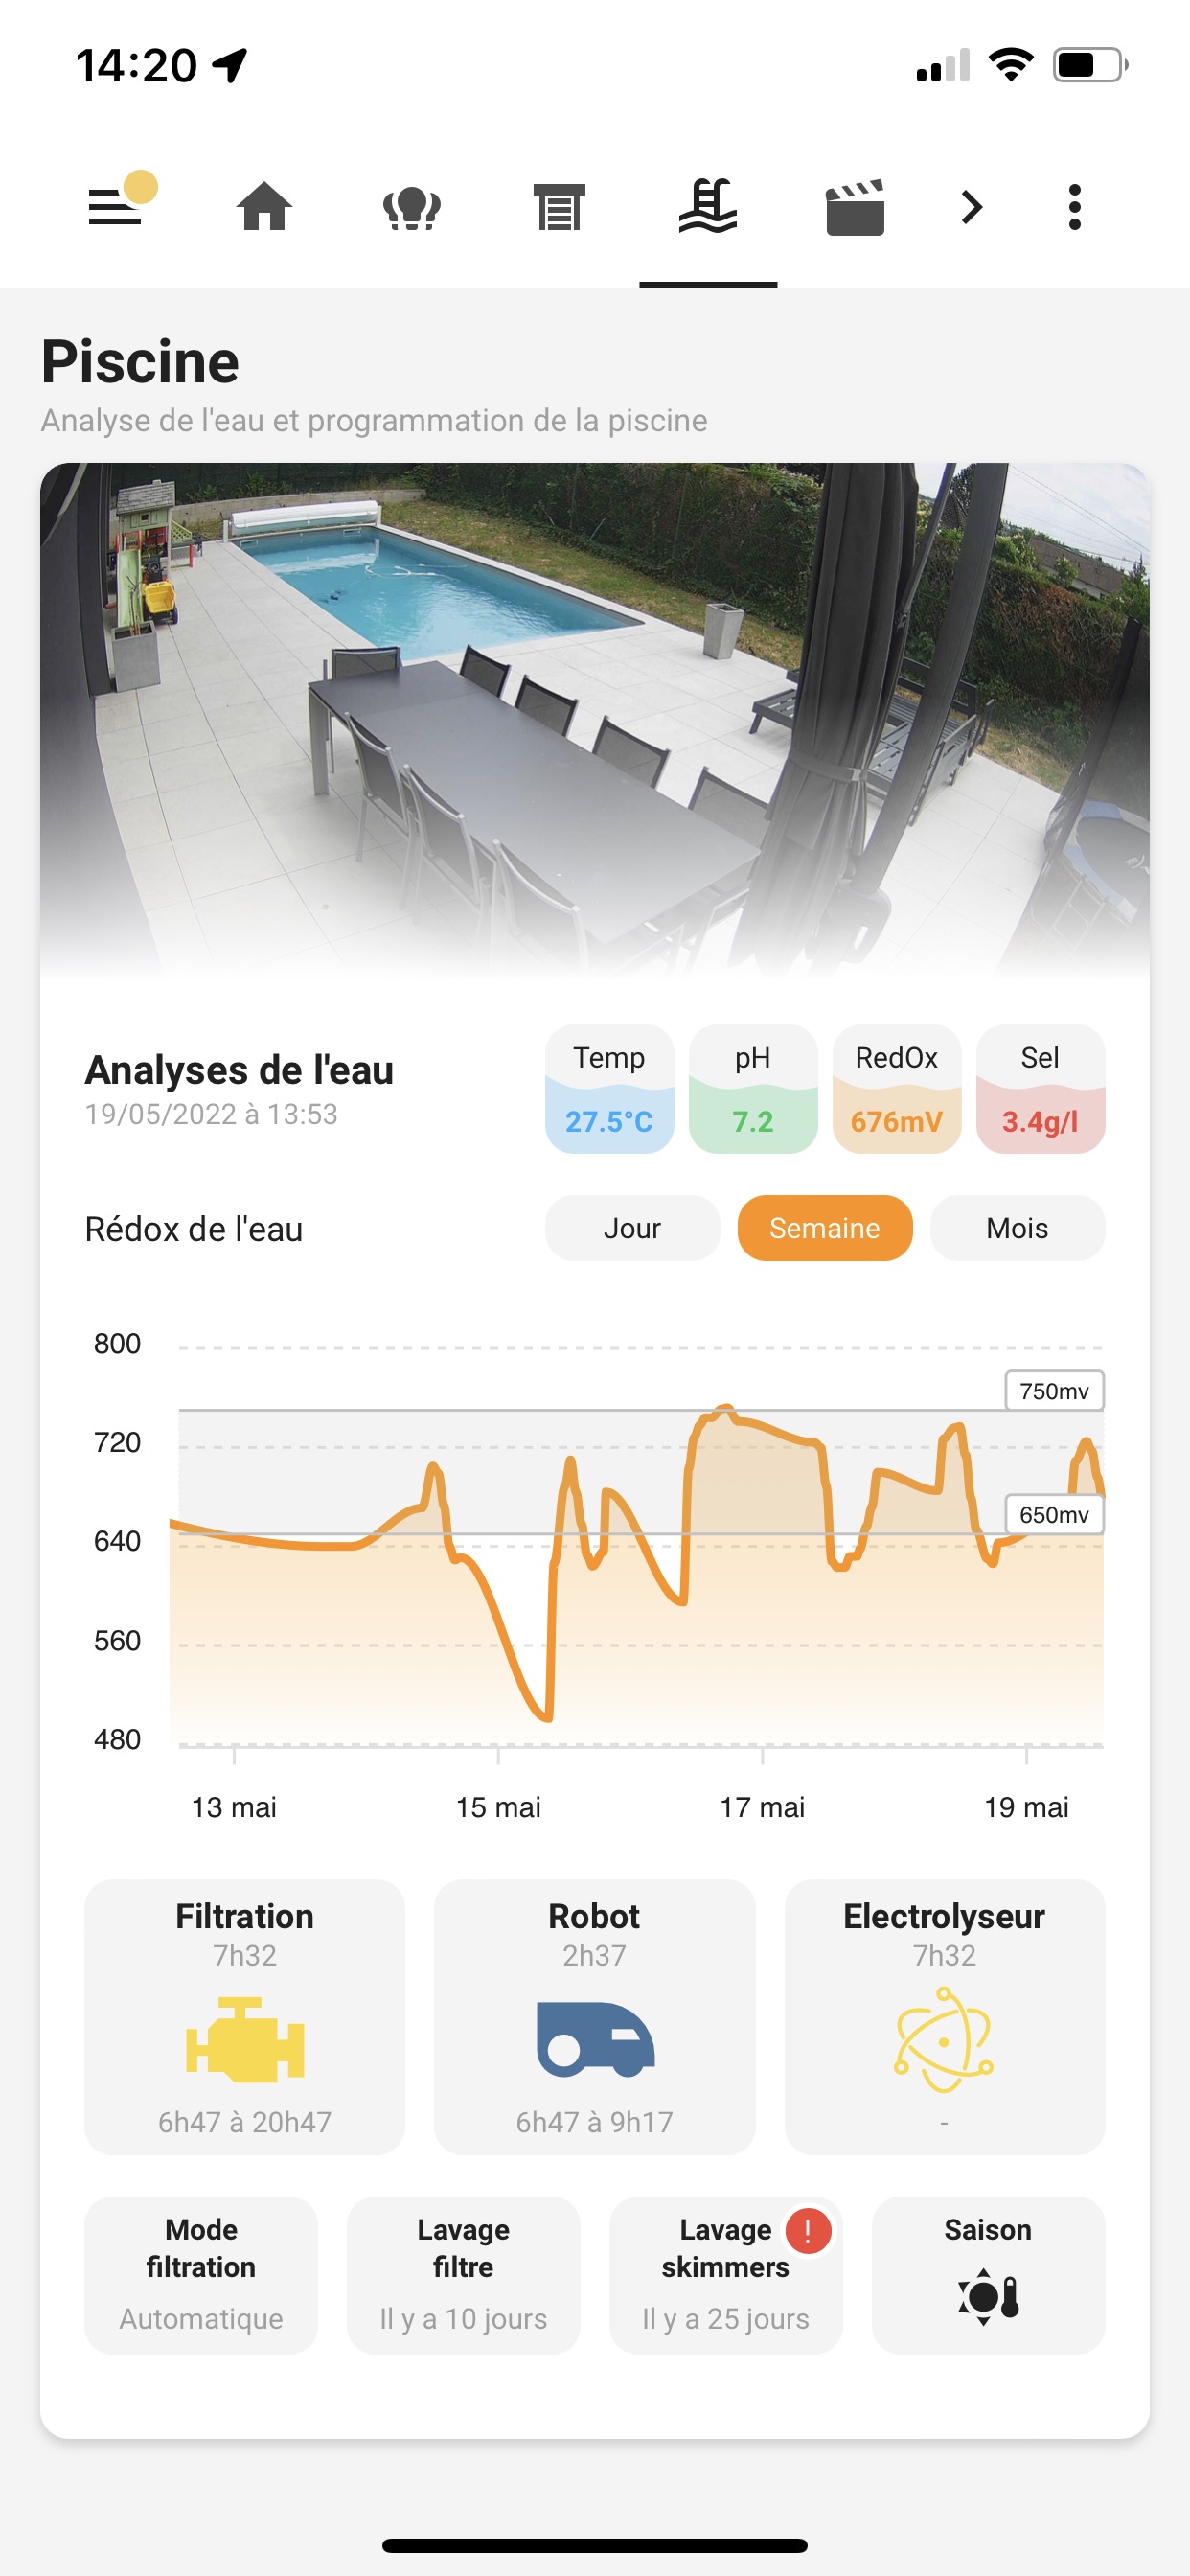
Yeah the card. Maybe you could use a pastebin or something like that? Now I don’t know French but the buttons just above the apex chart, what does them do?

EIDT: Did google translate that ^^, So you can change the time frame with buttons? That’s awesome and it’s that part I’m really interested in!

Yes, the buttons change graph data :

3 Likes

Wow that is even more awesome! How did you make that happen? Is just a nest of conditional cards with an input_select or how does this work?

SOLVED (it was clearing the browser cache…)
Un-intended: 2 versions in one installation
I made a mistake (i guess) and can’t figure out how to fix it.

I first “installed” the card manually (months ago, i think 1.10.0, but not sure…) by coping the .js file in the www folder. Things were fine on both web and in the HA app.
I decided to switch to HACS, installed HACS and from there the APEXcharts-card (version 2.0.1).
I manually removed the old .js files from the www folder and restarted HA.

I got errors on the mobile version as i used the deprecated extend_to_end, but no errors in the browser version.
I changed the extend_to to match the 2.0.1 version, now the mobile shows the graph nicely.

But in the browser i get an error:
// apexcharts-card version 1.10.0 /// value.series[0] is not a ChartCardSeriesExternalConfig; value.series[0].extend_to is extraneous

It seems to use the old version. How to fix this?

Try clearing your browser cache.

Can anybody see why forceNiceScale: true is being ignored in my charts?

type: vertical-stack
cards:
  - type: entities
    entities:
      - entity: input_select.days_back_to_show
        name: Number Of Days To Show
    title: Power
  - type: custom:config-template-card
    entities:
      - input_select.days_back_to_show
    variables:
      span: states['input_select.days_back_to_show'].state+'d'
      days: |
        -states['input_select.days_back_to_show'].state+'d'+'1d'
    card:
      type: vertical-stack
      cards:
        - type: custom:auto-entities
          filter:
            include:
              - entity_id: sensor.*_power
                area: living_room
                options:
                  yaxis_id: first
                  stroke_width: 2
                  group_by:
                    func: raw
                  type: line
                  opacity: 1
                  curve: stepline
                  fill_raw: last
          card:
            type: custom:apexcharts-card
            graph_span: ${span}
            yaxis:
              - id: first
                show: true
                min: 0
                decimals: 0
              - id: second
                show: true
                min: 0
                decimals: 2
            header:
              show: true
              show_states: true
              colorize_states: true
            apex_config:
              legend:
                show: false
              grid:
                show: true
              yaxis:
                forceNiceScale: true


Thank you for the reply.
I did that, without a result… Also tried a different machine, no luck.

Thanks, it in the appeared you where right.

1 Like

Is there any way to like change the group_by when moving from like 7d to 31d. I would like to have the daily and weekly grouped by hours and monthly and above to days. Same goes if your using the statistics, how to change the period from hour to day?

Like if days to show is more than 7 return day

I think you have two options:

  1. use an input_select together with an automation
  2. use code with an IF statement (e.g. javascript using the config-template-card GitHub - iantrich/config-template-card: 📝 Templatable Lovelace Configurations)

The second would be far prettier and I am sure someone can help with this (I am pretty bad with the coding part inside cards). You might well find examples in the forum though if nobody smarter than me responds.

The first option would be based on this thread:

Then you would create a second input_select for your groups and with the new IF statement in automations, change the grouping input_select based on the span input_select. All input_selects are global, so changing it on one graph will change the others also.

So that is an old school solution. Hoping for a slicker solution by someone else. :wink:

1 Like

I know that apex charts supports binary_sensor via

    transform: "return x === 'on' ? 1 : 0;"

But does anybody know if this can be used also for normal sensors with more than two states.
So instead of this if...else statement, an if...else if... statement?

Thanks!!! :+1::+1::+1:

Awesome, Thank you! I just added my sensors and changed the span and it works great for the most part.

There is an issue from time to time that the color gradient doesn’t work as it should. It is more of a compressed limit of every 15 minutes it starts over. I think it is from one of my sensors going offline and it resets the entire span causing this.

This is one I think a 12 hour span which is what it is supposed to look like.

This one is when the sensor went offline with a span of 24 hours set.

I also need to look at setting two different series (I think?). My living room and basement sensor is now on this same gradient which can be confusing. I have set the extremas which shows the color in the min/max box. But the actual line is now the gradient colors.

Another thing I’d like to look into is a dynamic time. I think someone else posted it above with a dropdown of various time spans.

And if we could also incorporate a input of set temps with an alarm and even a percentage of cook time remaining to that set point that would be awesome! This of course is for my Fireboard temp probes.

Something like this from Meater with the purple internal, blue target temp. Then it calculates the remaining time. I’m not even sure if ApexCharts is capable of this??

Thanks again!