alias: Remove old CPU usage data
description: ""
triggers:
  - trigger: time
    at: "18:38:00"
conditions: []
actions:
  - action: recorder.purge_entities
    metadata: {}
    data:
      keep_days: 7
      entity_id:
        - sensor.processor_use_percent
mode: single
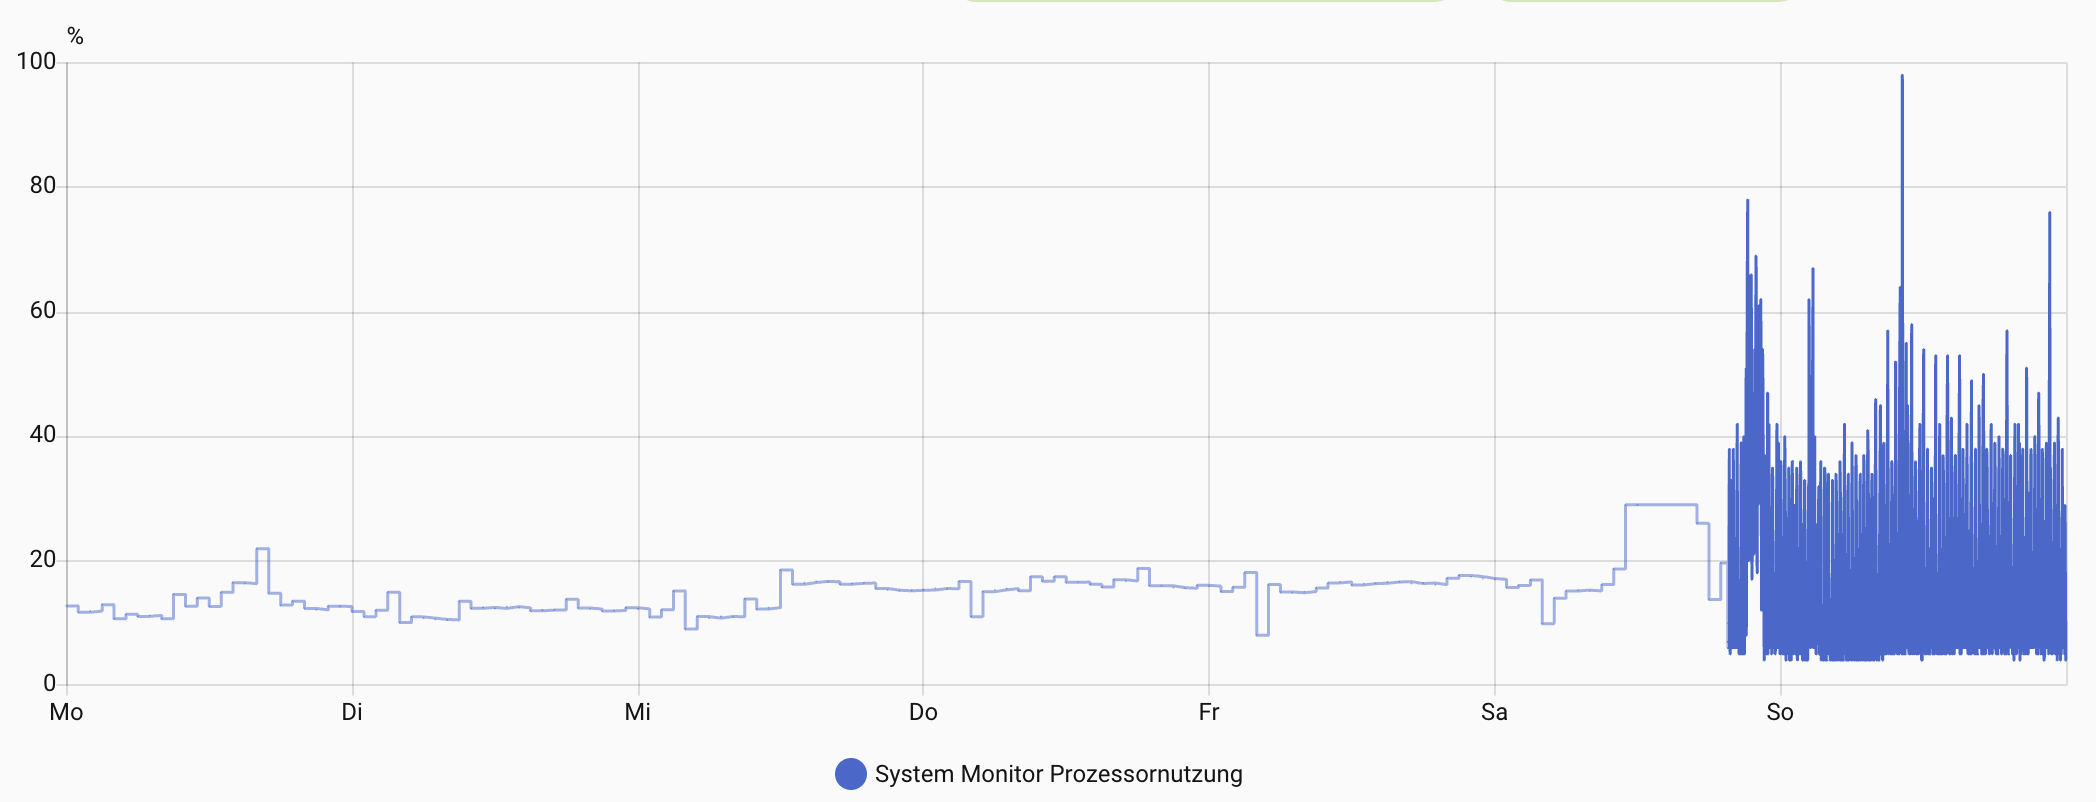
I let the automation trigger by time and started the automation manually some minutes later. When I afterwards opened the history (Verlauf) for this entity, I still see the data older than 7 days:
“Mo” - Monday? (27.10)
“So” - Sunday? (02.11)
It is 7 day, not more. Also, a History page may show an “augmented history” based on statistical data, but here you specified a period = 7 day (same as “keep_days”).
Yes, it is 7 days but it’s older than 7 days and shouldn’t be stored in the database anymore.
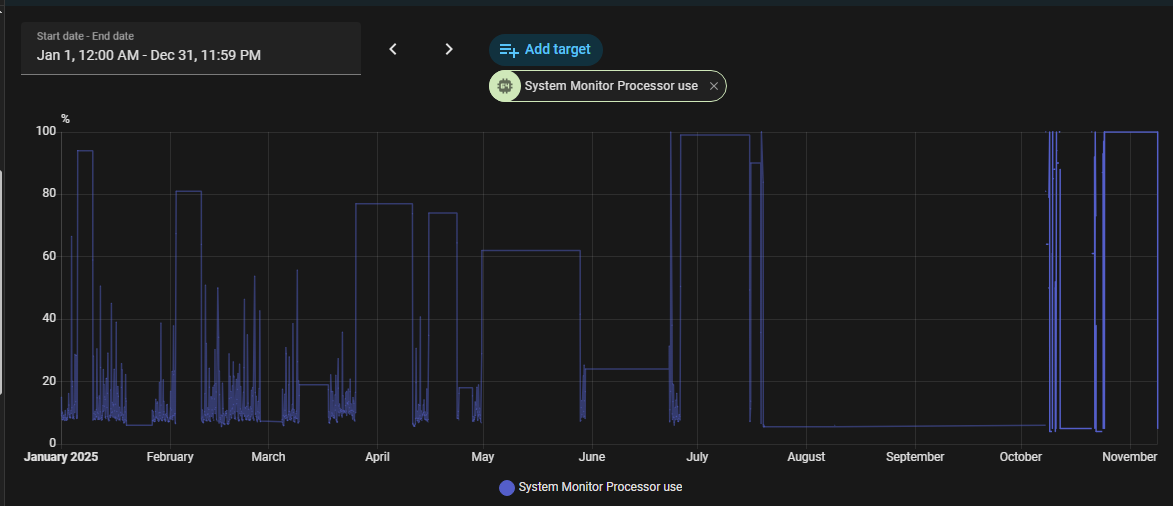
But meanwhile the older data is gone and only mean values - looks like one per hour - are shown in the history. So for others trying the same: Be patient; it takes some minutes to clean up
You mean statistics? You cannot remove them by native HA tools, but you can remove them by corr. sql queries. Perhaps someone with sql expertise can chime in…
Maybe
If older data displayed in history view (see screenshot above) is taken from statistics, yes.
Another question in this area:
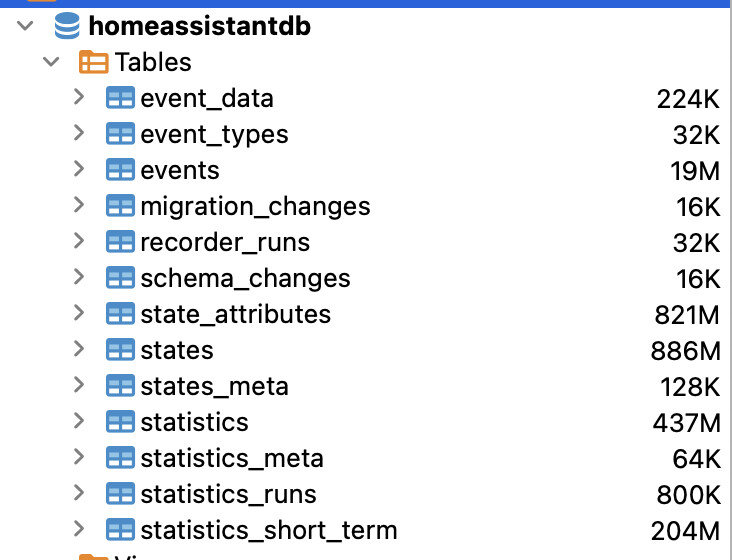
How can I see, which sensors are producing the biggest amount of data?
I’ve found the dbstats addon, but when running HA in docker on Linux at RPi, it does not work because there is no image for this environment. The only way is with installation natively on the Pi itself, which isn’t a good choice when going with docker for all applications.
I used DB browser for SQLite, opened a *.db file of HA database (accessible via SMB; also running HA in docker). Then I used SQL queries found here. I am not a DB expert, so it was like try/repeat. Also, that mentioned thread has several different queries posted, may be you need to use the latest one, no idea(((
If you don’t want to retain long-term statistics for certain entities, you can set them to state_class: none in customize.yaml. Long-term statistics are only kept for a few select state_classes.
Thanks for the hint, but I think, I will stay on the project and concentrate on biggest sensors.
I followed this hint and used DBeaver with this query:
SELECT
COUNT(*) AS cnt,
COUNT(*) * 100 / (SELECT COUNT(*) FROM states) AS cnt_pct,
states_meta.entity_id
FROM states
INNER JOIN states_meta ON states.metadata_id=states_meta.metadata_id
GROUP BY states_meta.entity_id
ORDER BY cnt DESC
Than I purged the first 15 sensors - mostly docker or system CPU or memory usage - which reduced the number of states by nearly 50% (from about more than 6 mio to about 3,2 mio).
SELECT
  COUNT(state_id) AS cnt,
   SUM(
    LENGTH(state_attributes.shared_attrs)
  ) AS bytes,
  states_meta.entity_id,states.attributes_id,state_attributes.shared_attrs
FROM
  states
LEFT JOIN state_attributes ON (states.attributes_id=state_attributes.attributes_id)
LEFT JOIN states_meta ON (states.metadata_id=states_meta.metadata_id)
GROUP BY
  states.metadata_id
ORDER BY
  bytes DESC
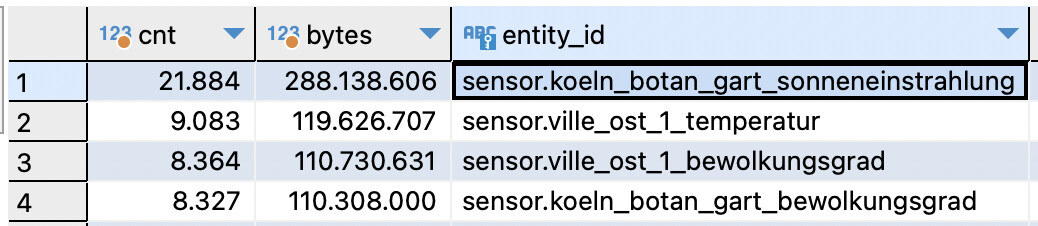
Whow. Thanks!
Ran it and - as assumed - weather data is the biggest. In my case a sensor for the UV Index sensor.koeln_botan_gart_sonneneinstrahlung, which seems to have a time series as attribute. 4 biggest sensors use more that half of the state_attributes size.
I think there was an effort recently to take dynamic data out of the “attributes,” at least for some entities. Not sure of the details, but you’ve identified the problem. Attributes (IMHO) should be static data. Things like friendly name, unit of measure, etc. Dynamic values don’t belong there.
The thing to do is ask yourself: Do you really need to keep long-term statistics on the offending entities? If not, change the state_class to “none” and be done with it.
The HA recorder isn’t all that customizable. You can’t set keep_days per entity, and you can’t decide which entities to exclude from long-term statistics without changing their state class. I’ve found sometimes I’m better off just sending the data I want to track to a text file using the files integration and store/analyze it outside of HA.