Create graph/automation based on river level

I’d like to incorporate the graph from NOAA’s website showing my local river level into HA. My goal is to create an automation if the forecasted river level is expected to exceed x feet. I’d also like to turn an RGB led the same color as the stages shown in the image.
For example if the forecasted river level is above 56’ trigger an automation that notifies me when I wake up, and change an RGB led to Red.

I’m very green to HA and appreciate any assistance in getting this working if possible.

Here’s a link to the weather gov page I’m referring to: National Weather Service Advanced Hydrologic Prediction Service

It looks like they have XML and RSS data available but I’m not sure how to manipulate that data.

1 Like

Anyone?..TIA

I’ll take a look at the xml and see. I would be interested in this also

Awesome thanks!

As a starting point, one could just grab all the content into an attribute. As a sensor, I have this:

##
## water.weather.gov
## 
- platform: rest
  name: Russian River Level
  resource: https://water.weather.gov/ahps2/hydrograph_to_xml.php?gage=guec1&output=xml
  value_template: "{{ now() }}"
  json_attributes:
    - site

This gives me this as a sensor which has all the XML (as JSON) attached to one attribute.

You could do many things with that. If you are familiar with HA, you can just create that sensor to your URL. I used Guerneville because that is where I live and we are almost at flood stage right now. I would also probably change the scan_interval because the data is certainly not something you need to grab every 30 secs,.

Extending that sample to eliminate some of the data to focus on observed and forecast, you would do this:

##
## water.weather.gov
## 
- platform: rest
  name: Russian River Level
  scan_interval: 3600
  resource: https://water.weather.gov/ahps2/hydrograph_to_xml.php?gage=guec1&output=xml
  value_template: "{{ now() }}"
  json_attributes_path: site
  json_attributes:
    - observed
    - forecast

You then have one sensor with two attributes, one is “observed” and one is “forecast”.

Let’s say you only want to know the maximum forecasted value. You could do this:

{% set levels = namespace(height=[]) %}
{% for level in state_attr('sensor.russian_river_level','forecast').datum %}
{% set levels.height = levels.height + [level.primary['#text']] %}
{% endfor %}
{{levels.height | max}}

Testing this gives:

Which is correct … the current forecast river level here is 33.1 ft. Going on from there you cn grab other values in the JSON (XML) like the monitor and flood values and compare to forecast and do what you like.

For me, I might actually wire this into the APEX Charts card, that would be a nice to have in our home dashboards.

1 Like

Here is an alternative that may prove better depending on your use. NOAA also provides raw CSV with just the graphical data for the chart. Using a command_line sensor and jq, you can process that to a more simplistic structure. Here is my example as of now. I am going to strip some characters out ("\r") and add names to the fields to make it easier to graph the data.

NOTE: This is a simplistic approach and could fail if the CSV data has quotes in it or something like that. I believe it works in many/most all NOAA cases though.

##
## water.weather.gov CSV
##
- platform: command_line
  scan_interval: 3600
  name: Russian River CSV
  command: "curl -s 'https://www.cnrfc.noaa.gov/graphicalRVF_csv.php?id=GUEC1' | jq --raw-input '{data: [inputs | split(\",\") | {datapoint: [.]} ]| .[2:999] }'"
  value_template: "{{ now() }}"
  json_attributes:
    - data

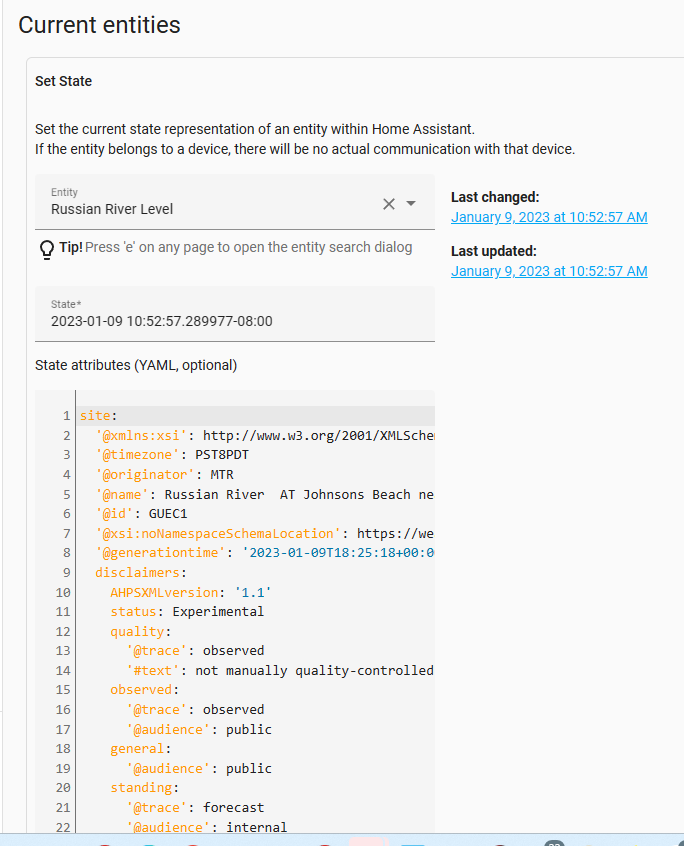
This using the NOAA CSV now to process it to JSON using ‘jq’ which should be in your installation. This sensor yields this:

You can download the original CSV from their website. For the sensor I excluded the the first line as it has the headers.

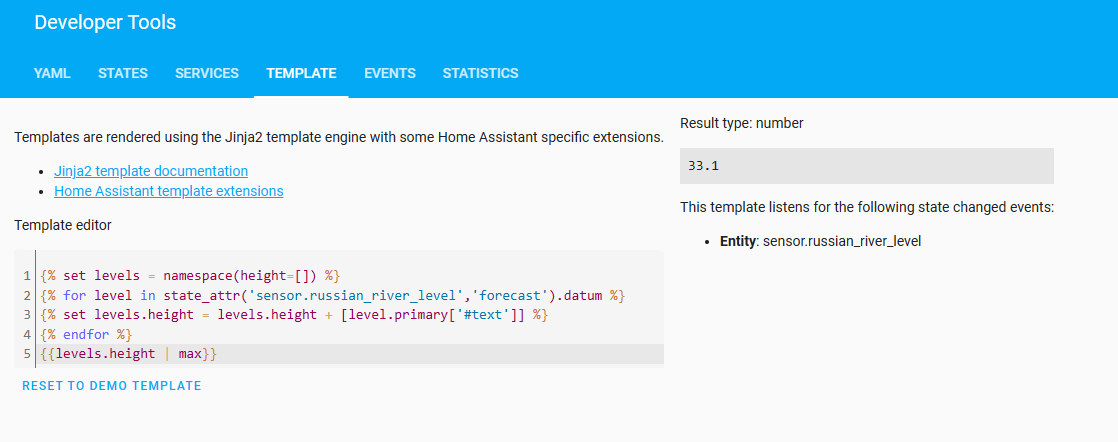
And now updated. This adds field names and converts the level to a number for charting purposes.

##
## water.weather.gov CSV
##
- platform: command_line
  scan_interval: 3600
  name: Russian River CSV
  command: "curl -s 'https://www.cnrfc.noaa.gov/graphicalRVF_csv.php?id=GUEC1' | jq --raw-input '{data: [inputs | split(\",\") | {datapoint: [ {issued: .[0], valid: .[1], level: .[2]  | tonumber, trend: .[3], status: .[4], mode: .[5] | gsub(\"[\\r]\"; \"\") } ]} ]| .[2:999] }'"
  value_template: "{{ now() }}"
  json_attributes:
    - data

With this, one would get this output with field names and no return characters:

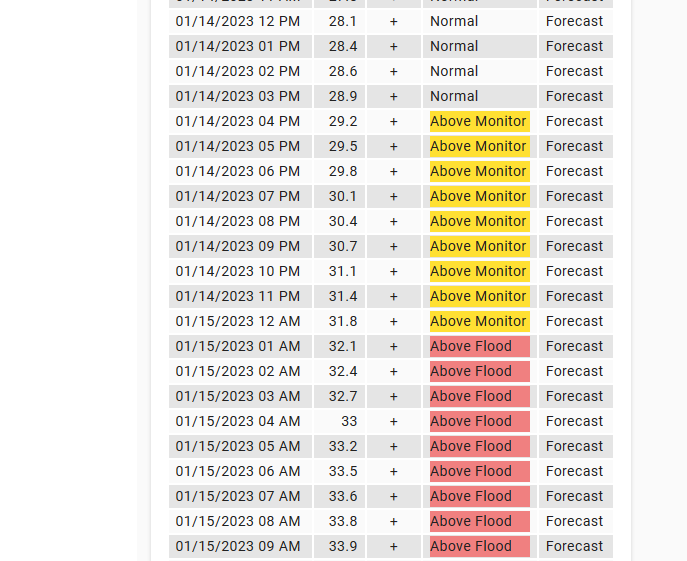
That sensor contains all the data to be able to draw this:

Looking through that data, I see this:

  - datapoint:
      - issued: 01/11/2023 08:27 AM
        valid: 01/12/2023 08 AM
        level: 31.6
        trend: +
        status: Above Monitor
        mode: Forecast
  - datapoint:
      - issued: 01/11/2023 08:27 AM
        valid: 01/12/2023 09 AM
        level: 31.9
        trend: +
        status: Above Monitor
        mode: Forecast
  - datapoint:
      - issued: 01/11/2023 08:27 AM
        valid: 01/12/2023 10 AM
        level: 32.1
        trend: +
        status: Above Flood
        mode: Forecast
  - datapoint:
      - issued: 01/11/2023 08:27 AM
        valid: 01/12/2023 11 AM
        level: 32.3
        trend: +
        status: Above Flood
        mode: Forecast
  - datapoint:
      - issued: 01/11/2023 08:27 AM
        valid: 01/12/2023 12 PM
        level: 32.4
        trend: +
        status: Above Flood
        mode: Forecast

So at 1/12/2023 at 10:00am Pacific, my river is forecasted to hit flood.

Hopefully @Glitchen with the above you have all you need. Someone could really turn this into standard sensor as the URLs are known (like mine is GUEC1). That would be the only variable.
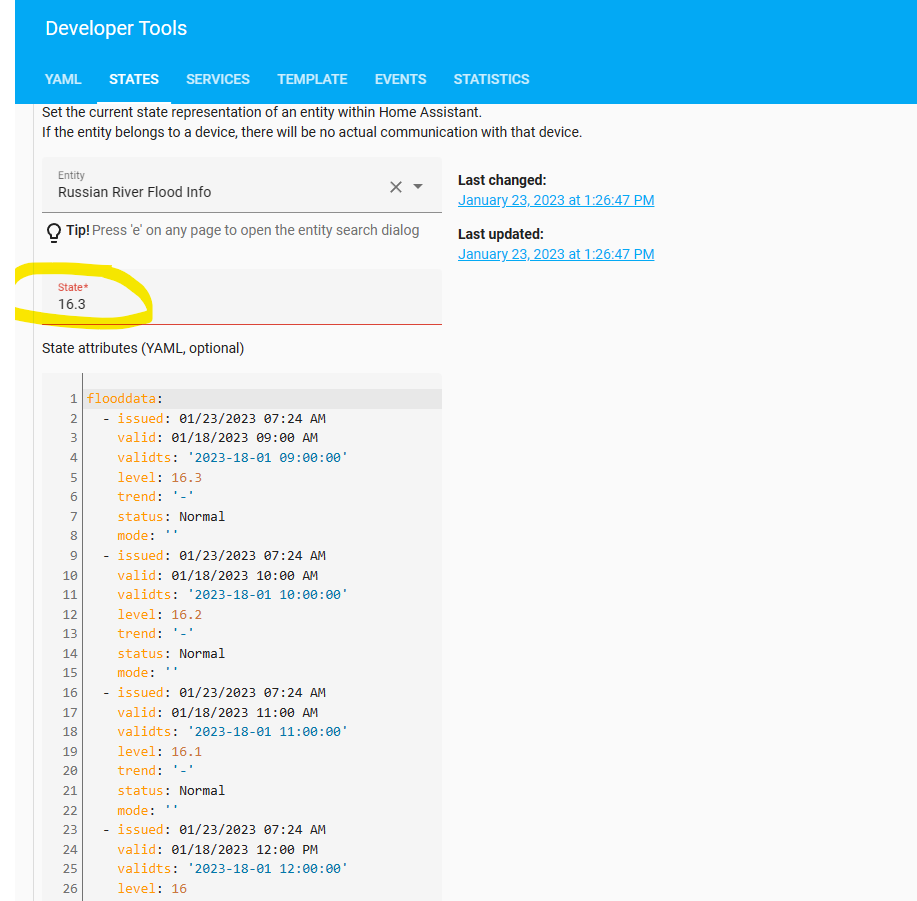
Another update:

In order to make this easy, I have gone this route for the data. This makes it much easier for charting and flex-table. This is just a slight change to flatten the JSON generated from the CSV.

##
## water.weather.gov CSV
##
- platform: command_line
  scan_interval: 3600
  name: Russian River Flood Data
  command: "curl -s 'https://www.cnrfc.noaa.gov/graphicalRVF_csv.php?id=GUEC1' | jq --raw-input '{flooddata: [inputs | split(\",\") | {issued: .[0], valid: .[1], level: .[2] | tonumber, trend: .[3], status: .[4], mode: .[5] | gsub(\"[\\r]\"; \"\")  }]| .[2:999] }'"
  value_template: "{{ now() }}"
  json_attributes:
    - flooddata
2 Likes

Stoked to see a fellow river rat working on this! Not many of us out here. I’ll incorporate into my HA.

1 Like

Using the last part of the post (parsing the CSV), I have created a custom:flex-table-card for the data.

type: custom:flex-table-card
title: Russian River Level
entities:
  include: sensor.russian_river_flood_data
columns:
  - name: Date/Time
    data: flooddata
    modify: x.valid
  - name: Level
    data: flooddata
    modify: x.level
    align: right
  - name: Trend
    data: flooddata
    modify: x.trend
    align: center
  - name: Status
    data: flooddata
    modify: x.status
  - name: Mode
    data: flooddata
    modify: x.mode

Results in this:

Ultimately I would love to … (1) do some custom JS to color the rows based on the flood status and then (2) replicate the NOAA site chart. Any help is appreciated, having a super-hard time trying to figure out the APEX card with such custom data without creating new sensors.

I think I know the issue … the NOAA CSV data is like “01/12/2023 01 PM” and this will not convert to a UTC date in ms. SO I need to modify the sensor to read the CSV and format the data as “01/12/2023 01:00 PM”

Update again:

Refer to this. I figured out how to colorize cells.

OK, the AM/PM issue resolved using the %I (for hour) and %p (for period). Now the sensor delivers the correct data:

##
## water.weather.gov CSV
##
- platform: command_line
  scan_interval: 3600
  name: Russian River Flood Info
  command: "curl -s 'https://www.cnrfc.noaa.gov/graphicalRVF_csv.php?id=GUEC1' | jq --raw-input '{flooddata: [inputs | split(\",\") | {issued: .[0], valid: .[1] | strptime(\"%m/%d/%Y %I %p\") | strftime(\"%m/%d/%Y %I:%M %p\"), validts: .[1] | strptime(\"%m/%d/%Y %I %p\") | mktime, level: .[2] | tonumber, trend: .[3], status: .[4], mode: .[5] | gsub(\"[\\r]\"; \"\")  }]| .[120:999] }'"
  value_template: "{{ now() }}"
  json_attributes:
    - flooddata

With some changes to the time data, I have succeeded in plotting this using GitHub - RomRider/apexcharts-card: 📈 A Lovelace card to display advanced graphs and charts based on ApexChartsJS for Home Assistant

With some styling:

1 Like

@joshualeone, I have mostly finished I will post in a separate thread and post link here. NOTE: you say “River Rat” … are you here in Guerneville or local? That is great if so.

OK to those that followed here, I posted a new thread in Share Your Projects with the full end solution on my system.

Enjoy!

3 Likes

kbrown01 - What an awesome response and I really appreciate it! I think that’s right on point what I’m looking for.

My intent was to post an update on how I was able to pull the highest forecasted level with python. But I’m going to follow your lead and abandon python.

If anyone is interested here’s the python code that seems to work:

import xml.etree.ElementTree as ET
import requests

url = 'https://water.weather.gov/ahps2/hydrograph_to_xml.php?gage=ccno1'
response = requests.get(url)
xml_data = response.content

root = ET.fromstring(xml_data)
forecast = root.find('forecast')

highest_stage = float("-inf")
for datum in forecast.findall('datum'):
    stage = float(datum.find('primary').text)
    if stage > highest_stage:
        highest_stage = stage

print(highest_stage)

Yep. If you followed the post, you could probably change the state (which I just insert the date) to the highest level easy.

##
## water.weather.gov CSV
##
- platform: command_line
  scan_interval: 3600
  name: Russian River Flood Info
  command: "curl -s 'https://www.cnrfc.noaa.gov/graphicalRVF_csv.php?id=GUEC1' | jq --raw-input '{flooddata: [inputs | split(\",\") | {issued: .[0], valid: .[1] | strptime(\"%m/%d/%Y %I %p\") | strftime(\"%m/%d/%Y %I:%M %p\"), validts: .[1] | strptime(\"%m/%d/%Y %I %p\") | strftime(\"%Y-%d-%m %H:%M:%S\"), level: .[2] | tonumber, trend: .[3], status: .[4], mode: .[5] | gsub(\"[\\r]\"; \"\")  }]| .[2:999] }'"
  value_template: >
        {% set levels = namespace(lvl=[]) %}  
        {% for height in value_json.flooddata %}
          {% set levels.lvl = levels.lvl + [height.level] %}
        {% endfor %}
        {{levels.lvl | max }}
  json_attributes:
    - flooddata

Of course, you may wish to only grab the data past today because the CSV goes +/- 5 days. Not sure if you want historical but you could just put an if into the for loop and only grab levels past the current data/time.And in graph/table format:

PS: Pleased that this is over!!! 44.1inches of rain here in 8 days!!!

Thank you so much, @kbrown01 !

I used your initial guidance on pulling the data from the XML on the weather.gov site (my local creek monitor is not on the NOAA site).

I’m pretty new to Home Assistant and my YAML templating is not up to scratch. I’m trying to figure out how to pull the latest observed creek level and time of update into a sensor, but my trial and error approach isn’t getting me very far. Are you able to share a suggested approach?

You send me your link that gets the data or the sensor code you have and I can look. It might take me a week or so to respond as I am traveling now.

Thanks for the help!

I have a sensor set up as suggested in your original post which is pulling observed values from the XML on water.weather.gov. Here’s its current state:

observed:
  datum:
    - valid:
        '@timezone': UTC
        '#text': '2023-04-19T23:20:00-00:00'
      primary:
        '@name': Stage
        '@units': ft
        '#text': '1.60'
      secondary:
        '@name': Flow
        '@units': kcfs
        '#text': '-999'
      pedts: HGIRR
    - valid:
        '@timezone': UTC
        '#text': '2023-04-19T23:19:00-00:00'
      primary:
        '@name': Stage
        '@units': ft
        '#text': '1.60'
      secondary:
        '@name': Flow
        '@units': kcfs
        '#text': '-999'
      pedts: HGIRR
    - valid:
        '@timezone': UTC
        '#text': '2023-04-19T11:20:00-00:00'
      primary:
        '@name': Stage
        '@units': ft
        '#text': '1.61'
      secondary:
        '@name': Flow
        '@units': kcfs
        '#text': '-999'
      pedts: HGIRR
    - valid:
        '@timezone': UTC
        '#text': '2023-04-19T11:19:00-00:00'
      primary:
        '@name': Stage
        '@units': ft
        '#text': '1.61'
      secondary:
        '@name': Flow
        '@units': kcfs
        '#text': '-999'
      pedts: HGIRR
    - valid:
        '@timezone': UTC
        '#text': '2023-04-18T23:20:00-00:00'
      primary:
        '@name': Stage
        '@units': ft
        '#text': '1.62'
      secondary:
        '@name': Flow
        '@units': kcfs
        '#text': '-999'
      pedts: HGIRR
    - valid:
        '@timezone': UTC
        '#text': '2023-04-18T23:19:00-00:00'
      primary:
        '@name': Stage
        '@units': ft
        '#text': '1.62'
      secondary:
        '@name': Flow
        '@units': kcfs
        '#text': '-999'
      pedts: HGIRR
    - valid:
        '@timezone': UTC
        '#text': '2023-04-18T11:20:00-00:00'
      primary:
        '@name': Stage
        '@units': ft
        '#text': '1.64'
      secondary:
        '@name': Flow
        '@units': kcfs
        '#text': '-999'
      pedts: HGIRR
    - valid:
        '@timezone': UTC
        '#text': '2023-04-18T11:19:00-00:00'
      primary:
        '@name': Stage
        '@units': ft
        '#text': '1.64'
      secondary:
        '@name': Flow
        '@units': kcfs
        '#text': '-999'
      pedts: HGIRR
    - valid:
        '@timezone': UTC
        '#text': '2023-04-17T23:20:00-00:00'
      primary:
        '@name': Stage
        '@units': ft
        '#text': '1.63'
      secondary:
        '@name': Flow
        '@units': kcfs
        '#text': '-999'
      pedts: HGIRR
    - valid:
        '@timezone': UTC
        '#text': '2023-04-17T23:19:00-00:00'
      primary:
        '@name': Stage
        '@units': ft
        '#text': '1.63'
      secondary:
        '@name': Flow
        '@units': kcfs
        '#text': '-999'
      pedts: HGIRR
    - valid:
        '@timezone': UTC
        '#text': '2023-04-17T11:20:00-00:00'
      primary:
        '@name': Stage
        '@units': ft
        '#text': '1.64'
      secondary:
        '@name': Flow
        '@units': kcfs
        '#text': '-999'
      pedts: HGIRR
    - valid:
        '@timezone': UTC
        '#text': '2023-04-17T11:19:00-00:00'
      primary:
        '@name': Stage
        '@units': ft
        '#text': '1.64'
      secondary:
        '@name': Flow
        '@units': kcfs
        '#text': '-999'
      pedts: HGIRR
    - valid:
        '@timezone': UTC
        '#text': '2023-04-16T23:20:00-00:00'
      primary:
        '@name': Stage
        '@units': ft
        '#text': '1.65'
      secondary:
        '@name': Flow
        '@units': kcfs
        '#text': '-999'
      pedts: HGIRR
    - valid:
        '@timezone': UTC
        '#text': '2023-04-16T23:19:00-00:00'
      primary:
        '@name': Stage
        '@units': ft
        '#text': '1.65'
      secondary:
        '@name': Flow
        '@units': kcfs
        '#text': '-999'
      pedts: HGIRR
    - valid:
        '@timezone': UTC
        '#text': '2023-04-16T11:20:00-00:00'
      primary:
        '@name': Stage
        '@units': ft
        '#text': '1.65'
      secondary:
        '@name': Flow
        '@units': kcfs
        '#text': '-999'
      pedts: HGIRR
    - valid:
        '@timezone': UTC
        '#text': '2023-04-16T11:19:00-00:00'
      primary:
        '@name': Stage
        '@units': ft
        '#text': '1.65'
      secondary:
        '@name': Flow
        '@units': kcfs
        '#text': '-999'
      pedts: HGIRR
friendly_name: Creek Info

I’d like to create a sensor that just updates with the latest observed value and the time observed, so that I can view its history in a chart and set up alerts based on its level.

Would someone be willing to help me get my local river level into a sensor? it would be from Real-Time Hydrometric Data - Water Level and Flow - Environment Canada

Real-Time Hydrometric Data for OUTAOUAIS (RIVIERE DES) A TERRASSE-VAUDREUIL (02OA107) [QC]

Looks like you might be able to pull data from the download CSV for that site in the same way as @kbrown01 outlined above, but I’m not skilled enough in YAML to be able to tell you how…

I’d still really appreciate your help with this @kbrown01 when you have a chance!

https://wateroffice.ec.gc.ca/report/real_time_e.html?stn=02OA107&mode=Table&startDate=2023-04-23&endDate=2023-04-30

In Italy on vacation returning Tuesday. Can help after that.

2 Likes

I think you want something like this to get CSV …

https://wateroffice.ec.gc.ca/services/real_time_data/csv/inline?stations[]=02OA107&parameters[]=46&start_date=2023-04-23%2000:00:00&end_date=2023-04-30%2023:59:59

Which yields this:

Then it all depends on what you want then. Just Max value or historical plotting or?

Notes: you can just get one day data … which for history would be appropriate run once a day. Just use the same date as the start and finish. The parameter value is 46 for Water Level or 47 for Discharge.

The issue you will hit is that (unfortuantely) the URL contains dates that would need to change. You will need to change the call to echo in date into the command_line or use some other way.