How do I integrate this for Mariadb and Influxdb? The log shows “exec /init: exec format error”. Not quite sure what to put in the config options connectionString* area.
Thanks for this nice add-on! For total noobs like me, it would be useful to add the default connection string in the doc (sqlite:////homeassistant/home-assistant_v2.db).
Just run it on the DB and apparently the persistent_notification domain is by far the largest event source. I didn’t even realise I was using this. Any idea where I can start digging to reduce this?
The default connection string in the configuration is sqlite:////homeassistant/home-assistant_v2.db, you should adapt this to use the location you set.
@jehy ,
just wanted to say thanks for this addon!
It’s really nice to get this sort of breakdown.
The only gotcha is that the connection string to configure is not so trivial, it worked for me with sqlite:////homeassistant/home-assistant_v2.db but I suggest you make this as default value (most of add-on users use home assistant OS and thus have the /homeassistant folder shared)
I installed a number of Everything Presence Lite sensors and indeed my DB size has grown a lot.
I’m struggling however in excluding them from the recording.
Here’s my recorder config:
recorder:
  purge_keep_days: 30
  exclude:
    domains:
      - device_tracker
      - media_player
      - uptime
      - time_date
      - worldclock
    entity_globs:
      # this assumes that all EverythingPresenceLite sensors are named sensor.epl_<something>
      - sensor.epl*target*
Does anyone knows if it’s OK to put 2 wildcards in an entry within “entity_globs” ?
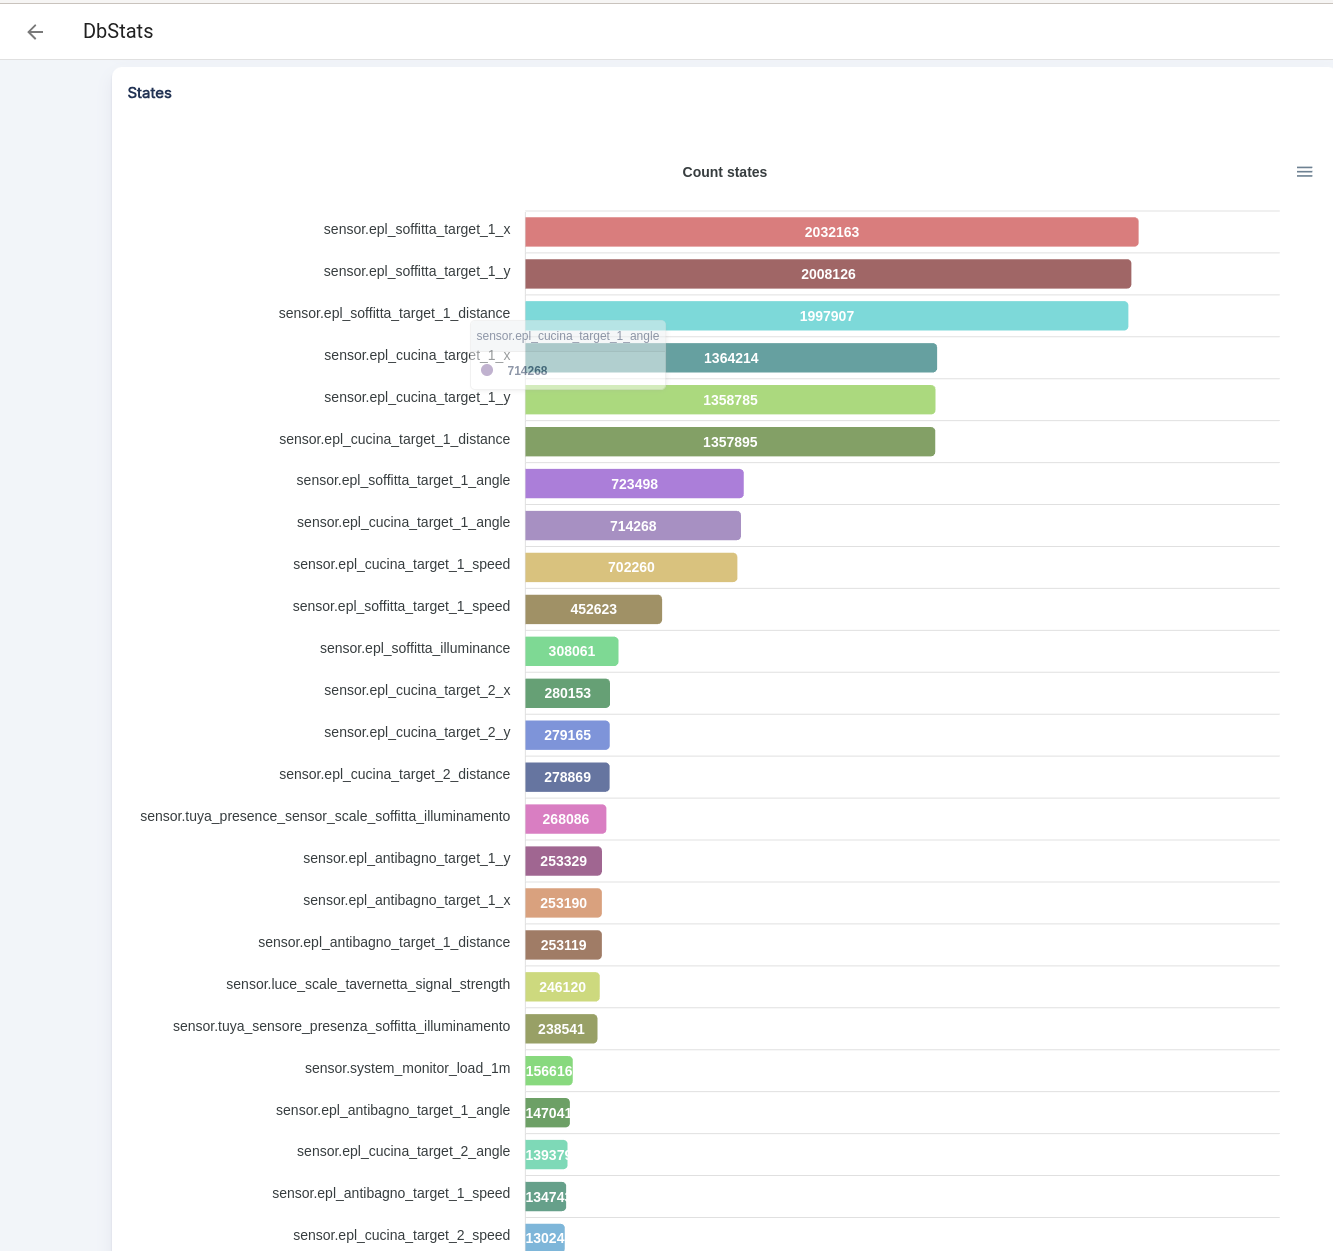
After restarting HA, I used the Developer Tools → Action panel to purge the database and then repack it. The size has decreased indeed, but using “dbstats” addon I still see that the sensors named sensor.epl*target* still account for the vast majority of the DB size:
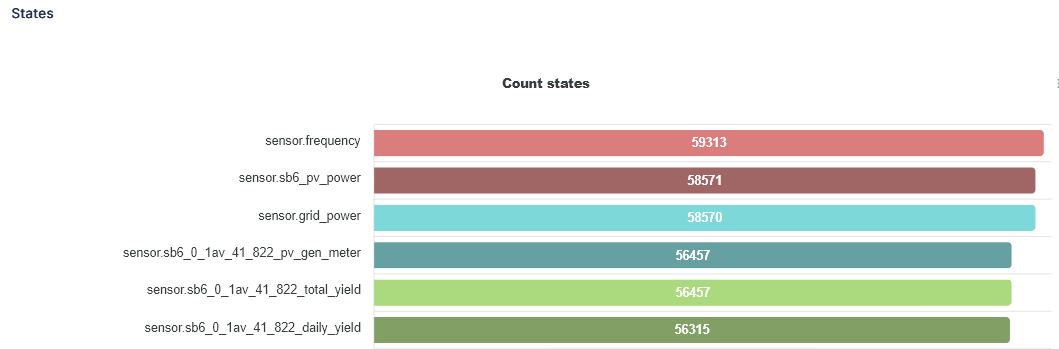
Yeah that should be fine. Not sure why but I’m seeing the same issue with plain entity excludes (not glob). I just excluded the sb6 entities shown here as I don’t use them:
@tom_l ,
I have a theory here.
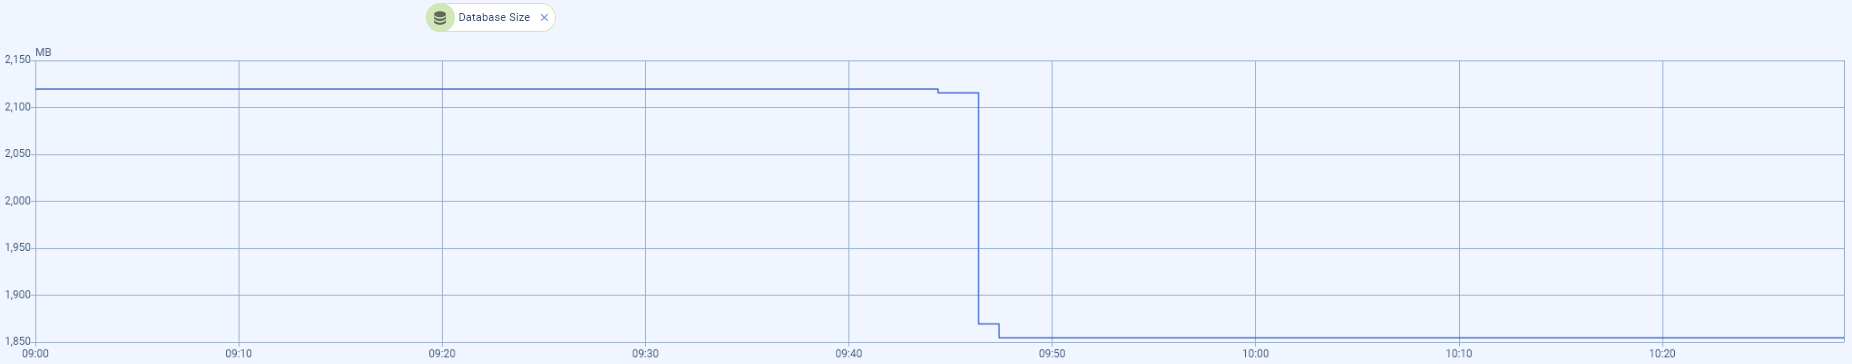
Today I noticed that the amount of “states” associated with my top-scorer sensor has decreased from ~2M to 1.932M.
So instead of increasing it decreased.
My recorder is configured to hold 30days. I believe what’s happening is that the Recorder has stopped to record new values for the excluded sensors but it will still take 30days to purge all the ones already recorded (prior to the exclusion rule I put in place)…
Thank you, @jehy ! DbStats has been very useful for me in identifying the entities taking up too much space in my Recorder database (already reduced from over 2.4GB to under 1.7GB). One question I had (and couldn’t find anything about in the add-on Configuration or the linked GitHub repo docs, though I haven’t looked at the code yet) - is there an option to show more than the top 30 results in the States table (or otherwise filtering by entity)?