Hi there,
(edit: damn! new users can only embed 1 image… I wanted my post to be as precise as possible but I’m not allowed to, so I now created a combined image with everything)
Quite new to the party, I’ve set up my installation about one month ago.
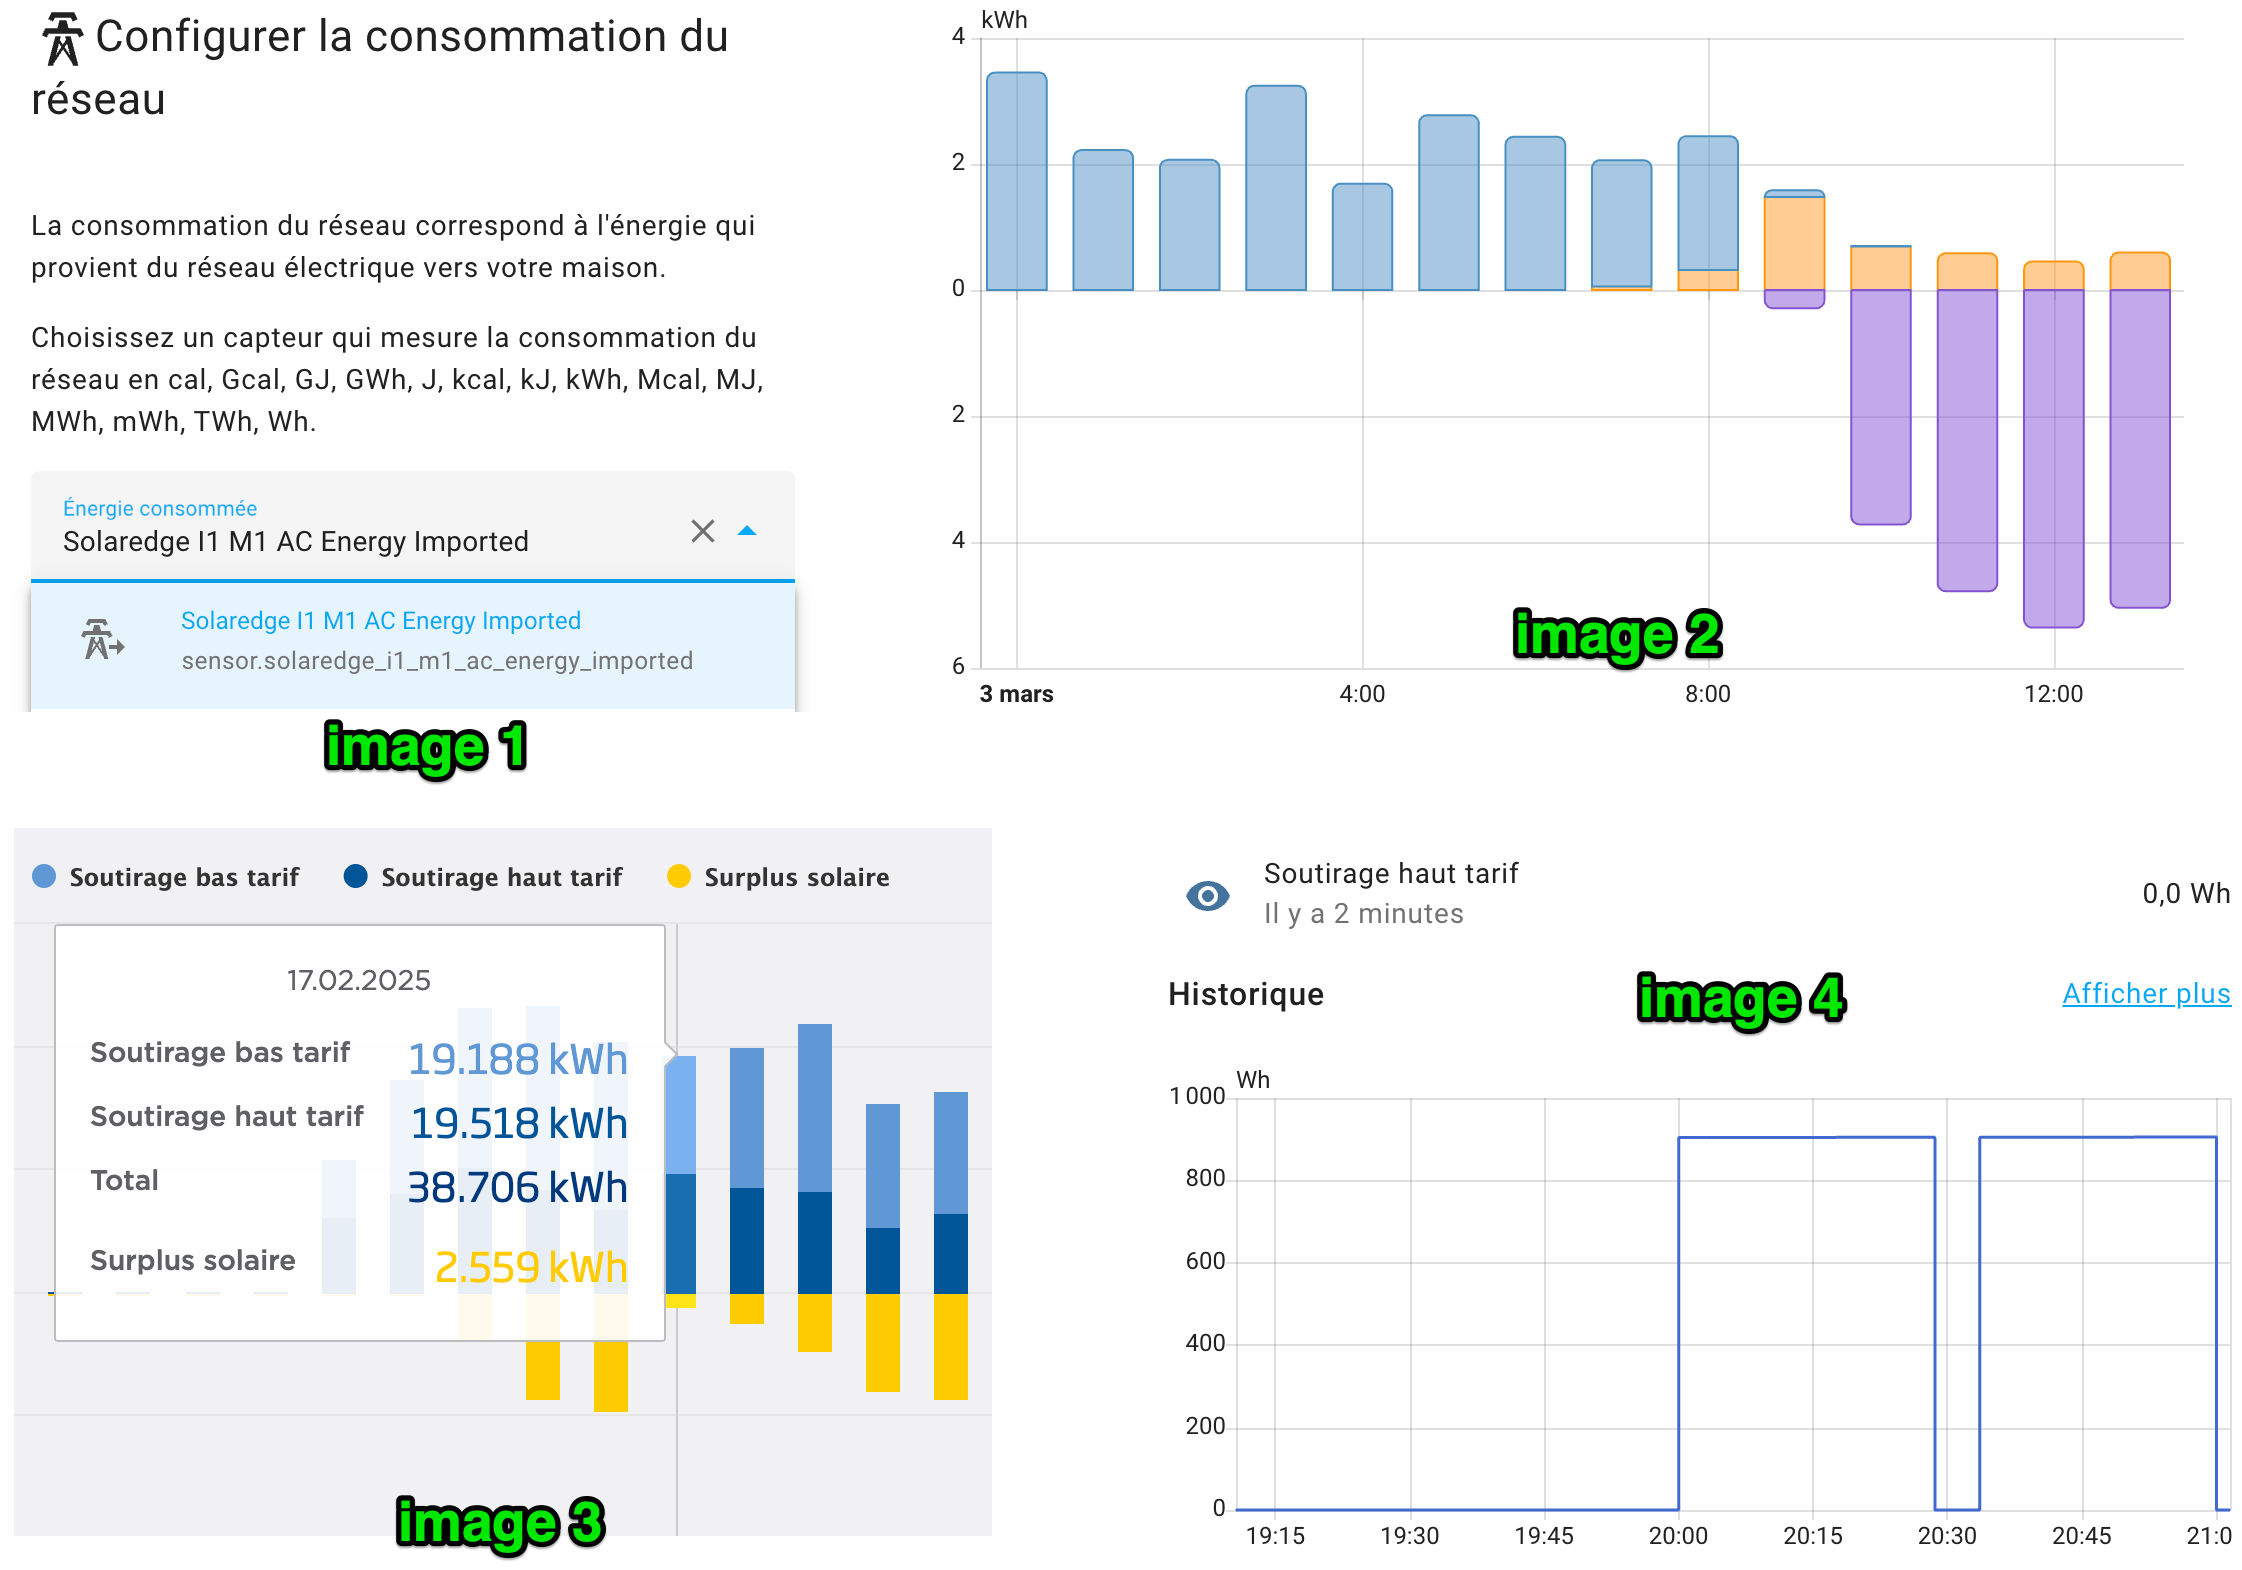
Under /config/energy, I configured the imported energy as sensor sensor.solaredge_i1_m1_ac_energy_imported:
(image 1)
I configured the production as well and everything is fine:
(image 2)
Now, my electricity provider has two different tariffs based on the time of the day (7AM-9PM is “high” or “haut tarif” in French, 9PM-7AM is “low” or “bas tarif” in French).
I successfully created a template sensor to have the corresponding price and used that in the Energy configuration.
Now, what I miss in the Energy tab is differentiating how much I imported at “high” or “low”. This should be quite trivial to do and as such I did that:
template:
  - trigger:
      - trigger: time_pattern
        hours: "*"
        minutes: 0
    sensor:
      - name: Tarif double 2025
        unit_of_measurement: "CHF/kWh"
        state: "{{ 0.3165 if now().hour >= 7 and now().hour < 21 else 0.2130 }}"
      - name: Haut tarif
        state: "{{ 1 if now().hour >= 7 and now().hour < 21 else 0 }}"
      - name: Bas tarif
        state: "{{ 0 if now().hour >= 7 and now().hour < 21 else 1 }}"
  - sensor:
      - name: Soutirage haut tarif
        unit_of_measurement: Wh
        state: "{{ states('sensor.solaredge_i1_m1_ac_energy_imported') | float(0) * states('sensor.haut_tarif') | float(0) }}"
      - name: Soutirage bas tarif
        unit_of_measurement: Wh
        state: "{{ states('sensor.solaredge_i1_m1_ac_energy_imported') | float(0) * states('sensor.bas_tarif') | float(0) }}"
The problem I seem to face is that my solaredge sensor is of class total_increasing and taking states('sensor.solaredge...') gives me the total value. The Energy tab is successfully using the exact same pointer and is able to aggregate data based on hour, day, … depending on what is selected.
So in short, how can I just “split” the imported energy into two subcharts, which ideally I could aggregate the same way as the native charts, but showing me the imported energy during “low” time, and during “high” time? Of course during the day, individual hour aggregation will show the same, but when aggregating over a day or more, I expect to get something similar to what my energy provider is showing me in its own dashboard:
(image 3)
Right now my template sensor gives that, and without waiting too long, it seems I missed something:
(image 4)
Thanks in advance for helping a newbie.