☔ DIY Zigbee rain gauge

Hi guys.

First Thanks to @parrel for sharing this excellent project and for the perfectly working yaml.

I used the exact same rain sensor, but instead of the Zigbee door switch, I used an esp8266 board (main powered), because my Zigbee network is quite busy (over 100 devices) and would certainly miss some pulses.

I flashed it with EspHome, connecting the pin 2 and 3 (from the RJ11 original wire) to GPIO12 and GND.

As it was working perfectly on the breadboard, when manually moving the sensor with my fingers, I soldered a quick PCB with a RJ11 female connector, and moved it outside…

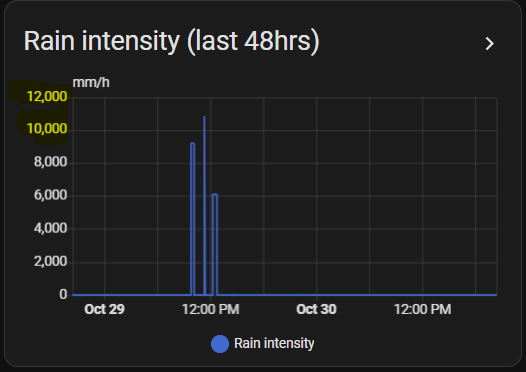
BUT Making further tests by pouring the sensor with water, … did not worked !!! :scream:
While the esphome correctly logged each flip , they were NEVER received by HA. :thinking:

After hours (days) of trying to figure what the problem was, I finnally found the reason and thus the cure. :beers:

The sensor is making a very short pulse (On state) before reverting to off state. And it seems that in this case, Esphome never send the ON state (while it correctly see it) when it is quickly followed by the Off state (certainly to not overload the network)

So for anyone wanting to use an EspHome device, here is the final configuration that works:

binary_sensor:
  - platform: gpio
    name: "Pulse"
    id: pulse
    icon: mdi:water-outline
    pin:
      number: GPIO12
      inverted: true
      mode:
        input: true
        pullup: true
    filters:
      - delayed_off: 120ms  # if too short, on state is logged but NOT sent to HA

   # the following optionnal part is used to blink the onboard led ###
    on_press:
      then:
        - logger.log: "--- Flip ------"
        - switch.turn_on: board_led
    on_release:
      then:
        - switch.turn_off: board_led

This part is the cure (it delays sending the off state by 120ms, after an On state) :

    filters:
      - delayed_off: 120ms

BTW in this case we are tracking the “on” state in the “rain flip” sensor:

- platform: history_stats
  name: Rain Flips 
  entity_id: binary_sensor.rain_pulse
  state: 'on'    # <-------- instead of 'off'
  type: count
  start: '{{ now().replace(hour=0, minute=0, second=0) }}'
  end: '{{ now() }}'

An thus we dont have any fake increments when HA restarts

HTH :sunglasses:

4 Likes

BTW if anyone from the EspHome (@esphomeGuru ?) team read this thread, it would certainly be REALLY HELPFULL (!!!) to document this behaviour in the EspHome documentation…

The documentation for GPIO binary sensors states that “Updates are processed once per loop cycle (same as polling mode)”.

So if the pulse is shorter than the loop cycle (which, by default, is 16ms), the sensor reverts back to OFF within the same cycle, and as far as ESPHome is concerned, nothing has changed since the last loop cycle.

I have read the GPIO binary sensors documentation.

  • Where am I supposed to guess that the loop cycle is as slow as 16ms on a 80Mhz CPU (where one cyle= 12.5 nano seconds) ?
  • How am I supposed to guess that “Updates” means “Updates sent to HA”, when Esphome correctly updates its own log, but silently doesn’t update HA ?
  • Why, even in Verbose mode (not tried very_verbose), the log doesn’t show if it updates HA or not?

Hence my suggestion to improve the documentation a little bit more :wink:

Interesting observation @soif - I’ve never come across this, most of my ESPxxx sensors are quite slow (I’m using Zigbee for my rain gauge, and analogue sensing for rain drops). I followed all the related esphome doco links I could find, the loop cycle is noted as occurring roughly 60 times a second which is where the 16msec comes from. Unrelated to CPU clock speed, although I didn’t locate where it is clearly defined.

It’s also referred to on several pages as every 7msec, just to confuse (me) further.

Thanks @soif, fixed! Glad it was so obvious for most, but I really appreciate your time.

Hi all. I have this same sensor running for about a year now. But try as I might, I can’t get Apexcharts to show the data from 2024 in this graph.
The data is there when I look at the history of the rainyear entity, but does not show here.
Anyone have a clue what I might be doing wrong here?

I think it’s because HA only has monthly long term statistics and not yearly. You need to aggregate (sum) all the monthly values of one year, for multiple years.

My Plotly graph:

type: custom:plotly-graph
title: Rain per year
hours_to_show: 6y
entities:
  - entity: sensor.rain_year
    name: Rain (year)
    period: month
    statistic: state
    type: bar
    filters:
      - fn: |
          ({ xs, ys }) => {
            const yearlyMax = {};
            for (let i = 0; i < xs.length; i++) {
              const d = new Date(xs[i]);
              const y = d.getFullYear();
              yearlyMax[y] = Math.max(yearlyMax[y] || 0, Number(ys[i]) || 0);
            }
            const years = Object.keys(yearlyMax).map(Number).sort((a,b)=>a-b);
            return {
              xs: years.map(y => new Date(y, 0, 1)),
              ys: years.map(y => yearlyMax[y])
            };
          }
    texttemplate: "%{y:.1f}"
    textposition: outside
layout:
  xaxis:
    tickformat: "%Y"
    dtick: M12
  yaxis:
    title: Rain (mm)
  bargap: 0.15

Never realised that…. Thanks for that code, added it to my dashboard :slight_smile:

Where can i find the STL file.

you buy it

I have the rain gauge, it was the support for the door sensor that I was missing, but I found it here: https://www.thingiverse.com/thing:5186770

1 Like

Would also like to ask if you’d still be willing to share the STL.

Hi,
i am a beginning Home Assistant user.
Where must I install the two sensors witch calculate the amout of rainfall.
A screenprint will help me a lot.

All the config yaml will need to be stored in the relevant section of your configuration.yaml file.

looking forward to trying this out - many thanks

1 Like

Thanks all for this thread, made my rain meter last week and working perfectly.

2 Likes

My PWS has been running fine for a couple of months now, proving very reliable once I improved my Zigbee network with repeaters. But after some light rain this week, the Intensity chart has me baffled:


I’m pretty sure I would have noticed if it was raining at a rate of 12 metres / hour! The daily rainfall for this date was 6.8mm. Previously this chart has been fine. I’ve checked the source data and the recorded bucket tips and hourly / daily rainfall for the days has been as expected.

Has anyone else noted any weirdness?

My code for this measure is:

template:
...
  - sensor:
      - name: 'Rain intensity (nPWS V2)'
        unit_of_measurement: 'mm/h'
        state_class: measurement
        unique_id: rainfall_per_hour_v2
        state: >-
            {% set rain_hour = ((state_attr('binary_sensor.rainfall_trend_v2', 'gradient') | float(0)) * 3600) | round(1, 'floor') %}
            {% if rain_hour >= 0 and states('sensor.rainfall_last_hr_v2')|float(0) > 0.0 %}
              {{ rain_hour }}
            {% else %}
              {{ 0 }}
            {% endif %}

TIA.

LOL

In the raw tip data, there were no tips recorded that were really close together? E.g. 2 tips in the same second?

Could you show the binary sensor activity during that period?

hi @parrel ,

interesting graph i copied it to my dashboard, looks like that

but i don´t understand the function behind. could you pls so kind and make an example for a monthlyrain graph too?

i use a simple bar for monthly

chart_type: bar
period: month
type: statistics-graph
entities:
  - sensor.rain_monthly
stat_types:
  - state
title: Monthly
days_to_show: 730

looks like that, but i want to compare with plotly graph card:

thanx!
br
Frank