Rain has never been more exiting
Last updated: December 2025
Sensor has been running on the same battery since December 2020
Today I want to share with you how I made a wireless battery powered Zigbee rain gauge for $20. It measures the rainfall amount in mm or inches. Furthermore, the battery life is +4 years!
The raingauge with a lighter and a pen for size comparison
Daily and monthly measured rainfall in mm
Modify the Rain Gauge
What you need:
- Aqara Door/window sensor (https://aliexpress.com/item/32991903307.html)
- Misol rain gauge (https://aliexpress.com/item/2026877912.html)
- Soldering iron
This is the rain gauge from the outside. Now lets take it apart by taking the top case off.
The gauge works with a reed switch, that closes and opens again when the bucket tips. You can pull out the board and see the sensor.
To make it wireless, we have to cut the wire! I cut it about this length. Then carefully strip the wires till you see some copper.
The next step is to solder the wires to the Aqara door sensor.
Normally there is a reed sensor there but I desoldered it for another project. I would suggest you desolder it, so it can not interfere with the magnet of the rain gauge.
If that’s done, it looks like this. You can now test it. If you didn’t yet, pair the sensor to ZHA, Z2M, Deconz etc.
Then you just insert the Aqara sensor in the casing. Notice the wire goes over the casing. I couldn’t get it in there, so I marked the spot where the wire goes over the frame, and made a cutout. This way I can still get the top back on.
Testing:
Calculate rainfall per gauge tip
So how do we calculate the rainfall? I found a useful amazon review from ‘packetrat’ for this rain gauge here. He explains how to calibrate the sensor.
You do need to calibrate it by measuring the surface collection area, and putting in a controlled amount of water from a syringe, etc. while counting the pulses. I measured mine at 5cm x 11cm, and 6 pulses per 10mL => 10/6 = 1.67mL per pulse.
1mm rain = 0.1511cm = 5.5 mL
1" rain = 2.54511cm = 139.70 mL@ 6 pulses per 10mL => 10/6 = 1.67mL per pulse
pulses / mm = 5.5 / (10/6) = 3.3
pulses / in = 139.7/(10/6) = 83.82mm / pulse = 0.30303
in / pulse = 0.01193
I also got 6 tips per 10ml so I used 0.30303mm per tip. If you use inches, it’s 0.01193 inch per tip. We can use that in a sensor to calculate the rainfall today, or in a week, or month, etcetera.
I set up two sensors to calculate this. One to count the times the state of the rain gauge was ‘closed’ today:
sensor:
  - platform: history_stats
    name: Rainsensor flips
    entity_id: binary_sensor.rainsensor_on_off #The aqara sensor
    state: 'off'
    type: count
    start: '{{ now().replace(hour=0, minute=0, second=0) }}'
    end: '{{ now() }}'
And one that calculates the daily amount of rainfall
template:
  - sensor:
      - name: Rainfall today
        unit_of_measurement: mm
        state_class: total_increasing
        unique_id: rainfall_today
        state: >-
          {% set count = states('sensor.rainsensor_flips') | int(0) %}
          {% set mm = count * 0.30303 %}
          {% if count >= 0 %}
            {{ mm|round(1, 'floor') }}
          {% endif %}
        # If you have issues with the history sensor doubling after restarting HA, add the line below (@BigG)
        availability: "{{ (states('sensor.rainsensor_flips') not in ('unknown', 'unavailable')) }}"
That’s it! Time to test it out under the tap and see the rainfall sensor increase!
Measure rain of a specific period
You can use the Utility Meter to measure Weekly, Monthly and Yearly rain. More options can be found here.
Weekly, Monthly and Yearly rain in Dutch
utility_meter:
  rain_week:
    source: sensor.rainfall_today
    cycle: weekly
    unique_id: rainfall_week
  rain_month:
    source: sensor.rainfall_today
    cycle: monthly
    unique_id: rainfall_month
  rain_year:
    source: sensor.rainfall_today
    cycle: yearly
    unique_id: rainfall_year
Measure rain intensity (mm/h)
During a heavy storm
binary_sensor:
  - platform: trend
    sensors:
      rainfall_trend:
        entity_id: sensor.rainfall_today
        max_samples: 2
template:
  - sensor:
      - name: "Rain intensity"
        unit_of_measurement: 'mm/h'
        state_class: measurement
        unique_id: rainfall_per_hour
        state: >-
          {% set rain_hour = ((state_attr('binary_sensor.rainfall_trend', 'gradient') | float(0)) * 3600) | round(1, 'floor') %}
          {% if rain_hour >= 0 %}
            {{ rain_hour }}
          {% else %}
            {{ 0 }}
          {% endif %}
Show your numbers in a graph
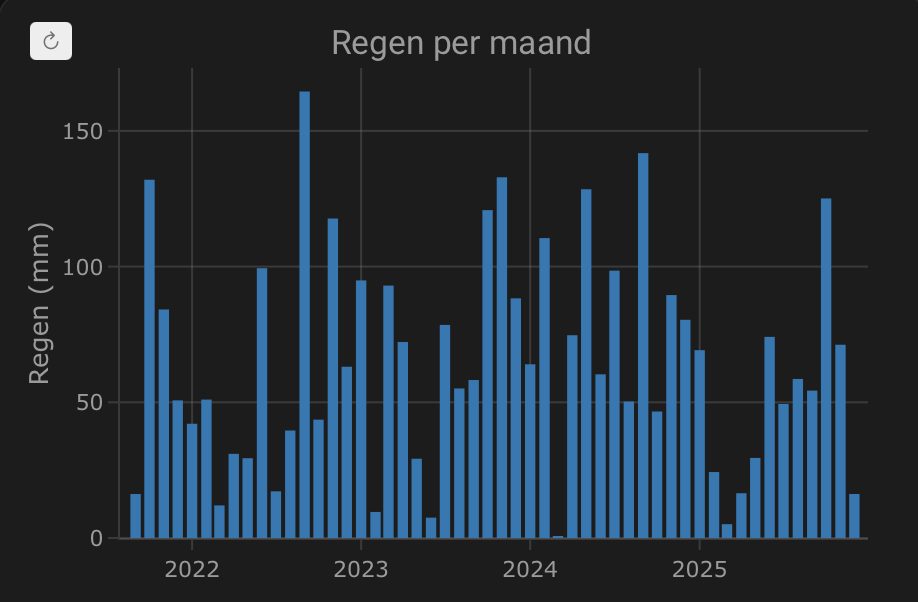
Monthly
YAML
type: custom:plotly-graph
title: Rain per month
hours_to_show: 6y
entities:
  - entity: sensor.rain_month
    name: Rain (month)
    period: month
    statistic: state
    type: bar
layout:
  yaxis:
    title: Rain (mm)
Yearly
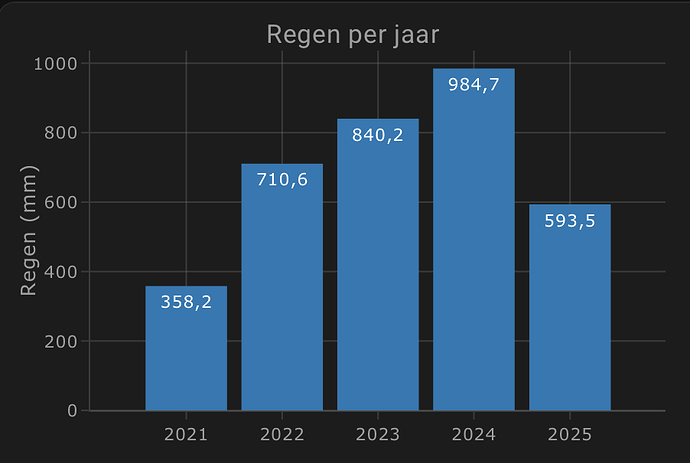
YAML
type: custom:plotly-graph
title: Rain per year
hours_to_show: 6y
entities:
  - entity: sensor.rain_year
    name: Rain (year)
    period: month
    statistic: state
    type: bar
    filters:
      - fn: |
          ({ xs, ys }) => {
            const yearlyMax = {};
            for (let i = 0; i < xs.length; i++) {
              const d = new Date(xs[i]);
              const y = d.getFullYear();
              yearlyMax[y] = Math.max(yearlyMax[y] || 0, Number(ys[i]) || 0);
            }
            const years = Object.keys(yearlyMax).map(Number).sort((a,b)=>a-b);
            return {
              xs: years.map(y => new Date(y, 0, 1)),
              ys: years.map(y => yearlyMax[y])
            };
          }
    texttemplate: "%{y:.1f}"
    textposition: inside
layout:
  xaxis:
    tickformat: "%Y"
    dtick: M12
  yaxis:
    title: Rain (mm)
  bargap: 0.15
Bonus: Add rain precipitation forecast to your graph
Integrate your local weather forecast into the graph with the rain gauge!
The code for this is different for each weather service.
Code for Buienalarm (The Netherlands)
Needs the custom component ‘Neerslag app’.
type: custom:apexcharts-card
graph_span: 24h
now:
  show: true
span:
  start: day
all_series_config:
  stroke_width: 2
series:
  - entity: sensor.rainfall_today
    name: Rainfall
    color: '#039ae5'
    extend_to: now
  - entity: sensor.neerslag_buienalarm_regen_data
    name: Precip
    extend_to: false
    color: grey
    unit: mm
    data_generator: |
      if (typeof entity.attributes.data.start == 'undefined') {return []}
      let start_date = entity.attributes.data.start * 1000;
      let start_state = Number(hass.states['sensor.rainfall_today'].state);
      return entity.attributes.data.precip.map((precip, index) => {
        if (index != 0) { start_date = start_date + (5 * 60 * 1000) }
        start_state += parseFloat(Math.pow(10, (precip - 109) / 32)) / 12;
        return [start_date, start_state];
      });
Also interesting
If you’re interested, I also made a wireless battery powered chair occupancy sensor this way.
If you got any questions, feel free to ask them!


 .
.


 thanks for that diy

