There’s also a fantastic card available in HACS that is based on the HA energy card, so the power view ties in perfectly with the energy view, with heaps of customisation.
2 Likes
Well… thank you so much. Total Google Fu fail on my part.
Let’s see how much work I get done today working from home. Only got the system yesterday. New toy!
For even more POWER visualisation, i can also duplicate the enphase view using
https://github.com/RomRider/apexcharts-card

type: custom:apexcharts-card
graph_span: 24h
stacked: true
header:
  show: true
  title: Total Power
series:
  - entity: sensor.power_production
    type: column
    name: Produced
    color: '#01B4DE'
    group_by:
      func: avg
      duration: 5min
  - entity: sensor.power_consumption
    transform: return x *-1 ;
    type: column
    name: Consumed
    color: '#F37320'
    group_by:
      func: avg
      duration: 5min
  - entity: sensor.power_net
    type: column
    name: Imported/Exported
    color: '#545456'
    group_by:
      func: avg
      duration: 5min
1 Like
For newbies like me here, the first post + GitHub - posixx/home_assistant_custom_envoy (+https://www.youtube.com/watch?v=kFVI6UOeySM) worked great on a D7 firmware
Thanks @del13r and @posixx
3 Likes
Thanks @alexeiw123
power-flow-card-plus was so much easier to setup!
type: custom:power-flow-card-plus
entities:
  grid:
    entity:
      consumption: sensor.power_import
      production: sensor.power_export
  solar:
    entity: sensor.power_production
  home:
    entity: sensor.power_consumption
Happy with the result

1 Like
Yes it’s very easy indeed.
I’m using 1s data in this view using this add-on but as you mentioned earlier, you need to be very aware of the recording this causes.
I exclude it from the recorder so that I can just use those outputs in real-time views.
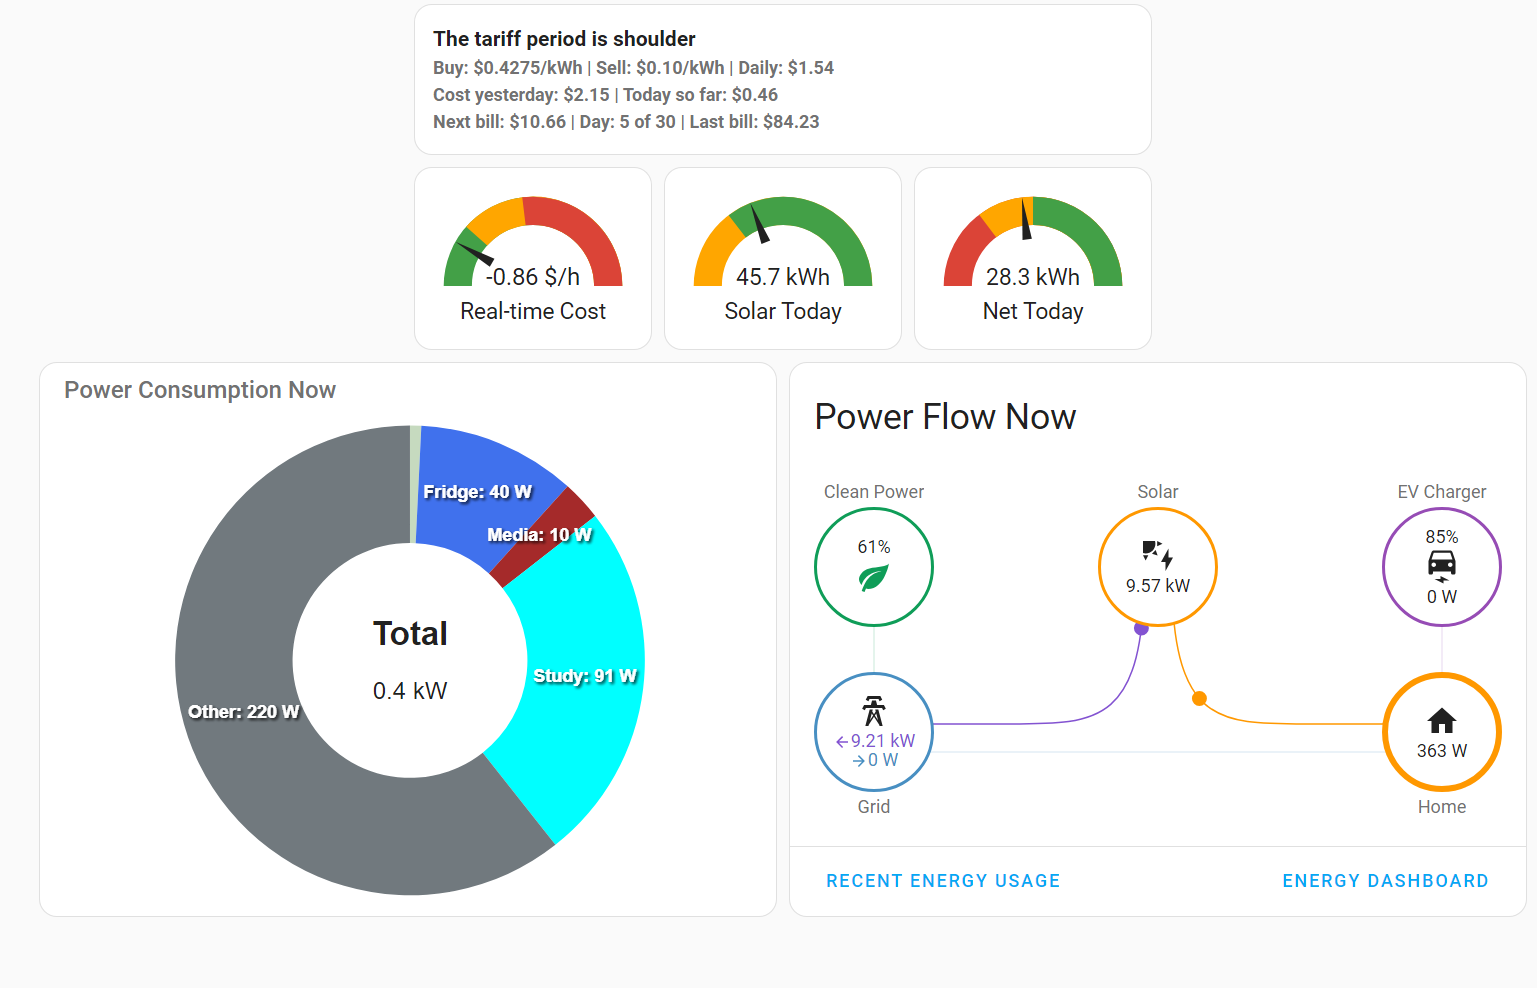
Getting a little O.T. but here’s my yaml if you want to cherry pick some of the teaks that I’ve made to it for my house.
title: Power Flow Now
entities:
  grid:
    entity:
      consumption: sensor.grid_import_power
      production: sensor.grid_export_power
  solar:
    entity: sensor.solar_power_corrected
    display_zero_state: true
  fossil_fuel_percentage:
    entity: sensor.grid_fossil_fuel_percentage
    color_icon: true
    display_zero: true
    display_zero_state: false
    state_type: power
    name: Clean Power
    secondary_info:
      entity: sensor.grid_clean_percentage
      unit_of_measurement: '%'
      unit_white_space: false
  individual2:
    entity: sensor.twc_charger_load_always_w
    icon: mdi:car-electric
    name: EV Charger
    color_icon: false
    display_zero: true
    secondary_info:
      entity: sensor.tesla_battery_level
      unit_of_measurement: '%'
      unit_white_space: false
  individual1:
    entity: sensor.ac_power_total_corrected
    icon: mdi:air-conditioner
    name: Air Con
    color_icon: false
    display_zero: false
    secondary_info:
      entity: climate.izone_controller_200011148
clickable_entities: true
display_zero_lines:
  mode: transparency
  transparency: 85
use_new_flow_rate_model: true
w_decimals: 0
kw_decimals: 2
min_flow_rate: 0.75
max_flow_rate: 6
max_expected_power: 10000
min_expected_power: 0.01
watt_threshold: 1000
dashboard_link_label: recent Energy Usage
dashboard_link: /lovelace-controls/energy-graphs
second_dashboard_link: /energy
second_dashboard_link_label: Energy Dashboard

1 Like

Thanks but I just added the hacs integration. I had my sensors and code aligned to yours. Just read all of your posts since and am a tad confused. Figures are not matching again since I could not figure out if I am missing something. Are you able to add detailed instructions please?
I think i understand why.
https://envoy.local/production.json returns total consumption

whereas https://envoy.local/ivp/meters/readings returns net consumption

As my latest (rest) solution uses a different source of information (net consumption), my template sensors have to calculate the total consumption by adding (production + net), whereas with the native/HACS integrations, the total consumption is already provided as they pull (total) consumption from https://envoy.local/production.json
Oh ok. Think you are being kind. I think I need a what you have in the yaml files inn detail. I am sure I have missed a few things. I also notice you have changed the names of your sensors.
Correct, due to the different (net) consumption information provided by https://envoy.local/ivp/meters/readings, my solution is no longer directly compatible with either the native or HACS integration anymore, hence the simplified sensor names.
I am now running independent of any integrations.
Why am I doing this?
2 reasons:
- I can choose the rest sensor update frequency myself.
- Here is a good example of the latency differences between the 2 different sources of information.

For this reason, I prefer to just use the rest sensors to extract only the information that I am interested in from the Envoy and then I just rely on the home assistant template sensors to perform the required calculations instead.
Makes sense. here is what I see

I would like to mimic what you have as its served me well. Therefore would be greatfull if you can post your config and settings again if ok. Even have the apexchart thing which is awesome.
Yep, these instructions are still what I am using.
These same rest sensor instructions also work with my apexchart instructions
example right now in home assistant

matching data in envoy (slight variation due to the lag it takes for envoy update the page at https://envoy.local/home)

In the meantime, I have been working on extracting/calculating the lifetime energy odometers from https://envoy.local/ivp/meters/readings using the same rest sensor as well.
Here is a preview of what I have been working on.
Obviously the envoy rounds up to the nearest .X decimal when viewing via https://envoy.local/home

I will do a complete solution write up for both power sensors (kW) and energy sensors (kWh) soon once I have time. I might even make a whole new topic just to save confusion as reading through 2 years worth of 674 posts is a big ask for anyone.
Here is my excel sheet I used to figure out what I can get from envoy using a rest call to https://envoy.local/ivp/meters/readings and what I have to calculate using template sensors to replicate the figures seen in https://envoy.local/home
Live Power figures:
| Source: /ivp/meters/readings | Power - Planned sensor naming in Home Assistant | W | kW |
|---|---|---|---|
| value_json[0].activePower | Power Production | 5317.82 | 5.32 |
| value_json[1].activePower | Power Net | -3281.97 | -3.28 |
| template sensor calculation | Power Consumption (Calculated) (production+net) | 2035.85 | 2.04 |
| template sensor calculation | Power Export (Calculated) (production-consumption) | 3281.97 | 3.28 |
| template sensor calculation | Power Import (Calculated) (consumption-production) | 0.00 | 0.00 |
Lifetime Energy figures:
| Source: /ivp/meters/readings | Energy - Planned sensor naming in Home Assistant | Wh | MWh |
|---|---|---|---|
| value_json[0].actEnergyDlvd | Energy Production | 25144588.32 | 25.14 |
| value_json[1].actEnergyDlvd | Energy Import | 11702118.55 | 11.70 |
| value_json[1].actEnergyRcvd | Energy Export | 10227297.59 | 10.23 |
| template sensor calculation | Energy Net (Calculated) (import-export) | 1474820.95 | 1.47 |
| template sensor calculation | Energy Consumption (Calculated) (production+net) | 26619409.28 | 26.62 |
I am able to get all this information from 1 single rest call/query every X seconds.
You can choose your own update interval in X seconds to suit your database sizing as updating these sensors more often will increase the database storage space needed to hold the history for graphing if you dont exclude these from the recorder.
My hope in using the lifetime energy odometers is that the energy figures will be more accurate if home assistant goes down for a restart or any similar event that would cause the integration sensors that I previously had in my solution to miss any gaps in recording.
Using the lifetime CT Clamp energy odometers instead will remove the need for the integration sensor and increase accuracy specifically in the energy dashboard.
2 Likes
Thanks @del13r . Your solution with REST works a lot better for me that the built-in integration or HACS integration. Better in that it seems to be more reliable — no more drop-outs at unknown times. Also, as you say, it is more responsive to immediate power changes. I used HA’s Riemann Sum Integral to get the energy, and that is also a lot more reliable compared to the HACS integration. HACS integration was giving me occasionally huge spikes, 10,000’s of kWH for day energy use, and unreliable numbers in the case of power outages.
1 Like
Thanks @khaimong
I’ve got a new and improved solution that doesn’t use Riemann Sum Integral sensors for energy anymore.
Just currently testing that it works perfectly and documenting how I did it in a new topic.
Watch this space.
Alrighty guys,
Here is the fully manual solution I came up with using just the rest sensor for Enphase Envoy on D7 firmware.
It’s a lengthy guide with lots of explanation.
Hopefully it helps someone else out.
2 Likes
I saw your post, and read you had managed to get some data from Wattson with an Optismart Gateway into HA ?
How did you manage this ?
If you have an installer account and use the HACS integration for installers you can create a nice live visual for each panel.

type: vertical-stack
cards:
  - type: custom:bar-card
    entities:
      - entity: sensor.envoy_122121028005_current_power_production
    title: Zonnepanelen
    max: '4200'
    decimal: '0'
    unit_of_measurement: W
    positions:
      name: 'off'
      indicator: inside
      icon: 'off'
    animation:
      speed: '5'
    style: |
      bar-card-currentbar, bar-card-backgroundbar { border-radius:10px; }
  - type: custom:bar-card
    entities:
      - entity: sensor.inverter_122125036304_production
      - entity: sensor.inverter_122125055320_production
      - entity: sensor.inverter_122125056463_production
      - entity: sensor.inverter_122125050047_production
      - entity: sensor.inverter_122125050256_production
      - entity: sensor.inverter_122125055948_production
      - entity: sensor.inverter_122125055365_production
      - entity: sensor.inverter_122125055364_production
      - entity: sensor.inverter_122125055383_production
      - entity: sensor.inverter_122125052776_production
      - entity: sensor.inverter_122125049990_production
      - entity: sensor.inverter_122125053078_production
      - entity: sensor.inverter_122125049589_production
      - entity: sensor.inverter_122125055469_production
    positions:
      name: 'off'
      indicator: inside
    columns: 5
    direction: up
    max: '300'
    min: '0'
    animation:
      speed: '5'
    decimal: '0'
    icon: 'off'
    height: 100
    width: 45px
    style: |
      bar-card-currentbar, bar-card-backgroundbar { border-radius:10px; }
4 Likes