Hello Enphase owners,
In August 2021, I wrote a topic on the Home Assisant Community forum about a solution I came up with to get my Enphase Envoy working with the Energy Dashboard feature which had just been introduced at the time.
That topic had a lot of great discussions, good ideas and many opportunities to help others.
I hope to do the same thing with this topic.
Why am I starting a new topic?
On Saturday the 8th of July 2023, my Enphase Envoy software verison was remotely automatically upgraded by Enphase from D5.0.62 (5e57a9) to D7.6.175 (f79c8d).
I was not alone as many others had noticed the same thing happen to them around the same time.
This forced software upgrade had caused the native Enphase Envoy integration to no longer work for me.
I was aware that other users firmware had been automatically updated months before mine had and were reporting the same issue with the native integration, so I sort of expected it and was keeping an eye on what alternative solutions were available should it happen to me.
Here is the native integration repository that did not support D7 firmware at the time of writing this article.
homeassistant/components/enphase_envoy
Update: D7 firmware is now supported by the native integration.
Here are Enphase related HACS repositories that I am aware of (sorted by last update date):
briancmpbll/home_assistant_custom_envoy
posixx/home_assistant_custom_envoy (archived on Jul 14, 2023)
jrutski/home_assistant_envoy_d7_fw
DanBeard/enphase_envoy
jesserizzo/envoy_reader
vincentwolsink/home_assistant_enphase_envoy_installer
What I noticed when trying to understand the code in some of the repositories was that often the source of information was from https://envoy.local/production.json which returns “Content-Type: application/json”.
Example of https://envoy.local/production.json

There are also some alternative repositories which use a technology called MQ Telemetry Transport (MQTT). They operate differently by initiating an ongoing stream of data from the envoy at https://envoy.local/stream/meter/ which returns updated data every second as “Content-Type: text/event-stream”.
MQTT Repositories:
vk2him/Enphase-Envoy-mqtt-json
helderfmf/Enphase-Envoy-mqtt-json
Example of 2 seconds of data

I will not be discussing the MQTT solution here. Please visit the MQTT repositories and read the guides if you are interested in getting updates per second.
As you can see, there are a lot of people who are trying to fix issues found when trying to extract information from their Enphase Envoy and therefore a lot of options to try and evaluate what will or won’t work for you.
Why am I using a different approach?
I saw all of this variety of repositories as a little overwhelming and confusing, which prompted me to try and figure out how to extract ONLY the information that I want from the Envoy myself.
Previously on D5 firmware, all I was interested in was 2 data points/sensors: power consumption(kW), power production(kW).
From just those 2 sensors, I would calculate grid import/export and then record energy over time using Riemann sum integral.
1 new piece of information that is currently floating around is the Enphase Technical Brief.
The first thing I did was compare the performance of how long it takes to obtain information from the old endpoints https://envoy.local/production.json (2500ms or 2.5 seconds)
vs some of the new api endpoints
https://envoy.local/ivp/meters/readings (64ms)
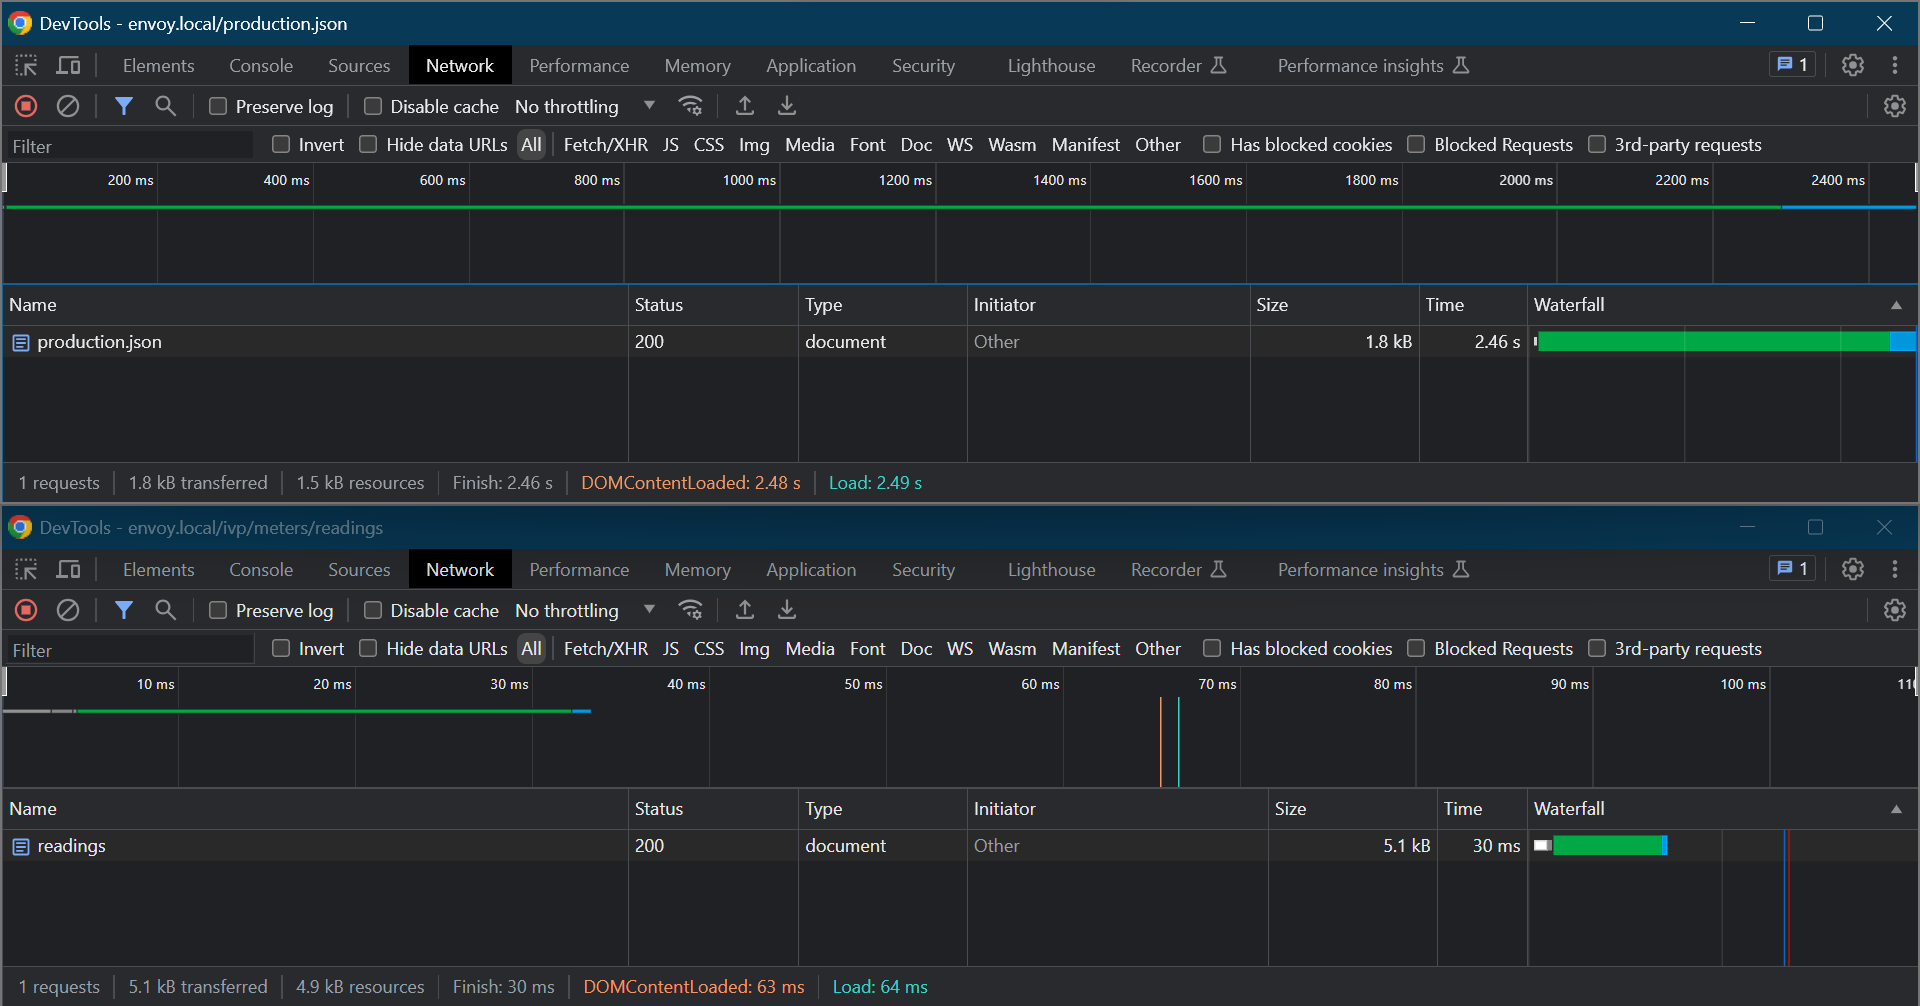
For me, the results were consistently poor for https://envoy.local/production.json when compared to the much more efficient https://envoy.local/ivp/meters/readings so I decided to pursue extracting information from this endpoint instead.
What I immediately noticed was that the figures I was able to extract were
- 2 x power in W (power production / power net)
- 3 x energy lifetime odometer readings in Wh (energy produced /energy imported / energy exported)
It was immediately obvious to me that this data was exclusively related to both the production and consumption CT clamps.
I then assumed that perhaps the absense of any calculated data in the response is probably why the page load time is so much faster as the envoy does not have to perform and calculations before providing the data.
Here is what a CT clamp looks like

Every Enphase Envoy system has at least 1 CT Clamp installed for measuring the solar production and optionally have a second CT Clamp for consumption.
The consumption CT Clamp can be installed in 1 of 2 possible locations.

Mine is installed as load with solar production which appears to be the most common.
If your enphase envoy is set to total-consumption/load only, then I recommend following this post for load only users
Lets compare what I can see being reported at https://envoy.local/home right now:

Here is a sample of the information I am able to extract from
https://envoy.local/ivp/meters/readings
        "eid": 704643328,
        "timestamp": 1689894382,
        "actEnergyDlvd": 25392556.647,
        "actEnergyRcvd": 0.000,
        "apparentEnergy": 29290920.936,
        "reactEnergyLagg": 5638991.364,
        "reactEnergyLead": 58003.665,
        "instantaneousDemand": 687.208,
        "activePower": 687.208,
        "eid": 704643584,
        "timestamp": 1689894382,
        "actEnergyDlvd": 11970525.537,
        "actEnergyRcvd": 10297737.507,
        "apparentEnergy": 30839131.680,
        "reactEnergyLagg": 25562.047,
        "reactEnergyLead": 12126441.651,
        "instantaneousDemand": 892.938,
        "activePower": 892.938,
Note: Due to the 2.5 second lag/delay when getting data from production.json, it is impossible to get fully identical matching data for demonstration purposes. Please keep that in mind when comparing that it may be 1 watt different.
Looking at what I am able to get from https://envoy.local/ivp/meters/readings, I can get power production and power net.
From those 2 figures, I am able to calculate 3 additional figures: power consumption, power export, power import.
| Source: /ivp/meters/readings | Description | W | kW |
|---|---|---|---|
| value_json[0].activePower | Power Production | 687.208 | 0.69 |
| value_json[1].activePower | Power Net | 892.938 | 0.89 |
| template sensor calculation | Power Consumption (Calculated) (production+net) | 1580.146 | 1.58 |
| template sensor calculation | Power Export (Calculated) (production-consumption) | 0.000 | 0.00 |
| template sensor calculation | Power Import (Calculated) (consumption-production) | 892.938 | 0.89 |
I also noticed that I can get 3 lifetime energy sensors: Energy Production, Energy Import, Energy Export.
From those 3 figures, I am able to calculate an additional 2 figures: Energy Net, Energy Consumption.
| Source: /ivp/meters/readings | Description | Wh | MWh |
|---|---|---|---|
| value_json[0].actEnergyDlvd | Energy Production | 25392556.647 | 25.4 |
| value_json[1].actEnergyDlvd | Energy Import | 11970525.537 | 12.0 |
| value_json[1].actEnergyRcvd | Energy Export | 10297737.507 | 10.3 |
| template sensor calculation | Energy Net (Calculated) (import-export) | 1672788.030 | 1.7 |
| template sensor calculation | Energy Consumption (Calculated) (production+net) | 27065344.677 | 27.1 |
Note: You may also notice that the display at https://envoy.local/home does round this up to the nearest decimal point but this is just a cosmetic difference in the interface. My table also does this to match.
When comparing these tables with the data shown at https://envoy.local/home, all of my calculated data lines up and the math checks out.
Now I am happy with the results, the next thing I need to do is generate a 12 month JSON Web Token (JWT).
For those who aren’t aware, the new issue introduced with the D7 firmware, is that Enphase introduced a JSON Web Token (JWT) feature which is supposed to increase security.
This is done by making you login to an enphase website and generate a JWT which lasts for 12 months and then everytime you request data from the envoy, you need to provide this 408 character string to prove to the device you are authenticated to access. The JWT contains your serial number and your enphase username/email address as well as when it was issued and when it will expire.
Here is a sample of what the JWT token looks like when decoded at https://jwt.io/

This new JWT feature is what broke the native Enphase integration and why there are now HACS repositories that fill the gap that the native integration has with D7 firmware.
I figured, as the token is valid for 12 months, I will try to develop a way to automate this JWT generation in the future and focus on the more immediate issue of getting power and energy data from my Enphase Envoy instead.
There are currently 3 methods that essentially perform the same task.
- The first method is via 2 seperate cURL commands.
You can run these cURL commands on any system that has cURL installed.
command:
curl -s -d 'user[email][email protected]&user[password]=MYPASSWORD' \
https://enlighten.enphaseenergy.com/login/login.json \
| jq -r .session_id

Result:
32CHARACTERSESSIONID
then I used my envoy serial number and that session ID in the next command to get my token.
curl -s 'https://enlighten.enphaseenergy.com/entrez-auth-token?serial_num=ENVOYSERIALNUMBER' \
-H 'cookie: _enlighten_4_session=32CHARACTERSESSIONID' \
| jq -r '.token'

Result:
408CHARACTERJWT
- The second method is by using a python script.
You can run this on any system that has python installed.
Here is an example of me modifying the 3 inputs and then pasting it into python and the result is the 408 character token at the bottom which i have obfuscated for privacy.

- The third method is to first login to enlighten and then add your serial number to the end of this URL:
https://enlighten.enphaseenergy.com/entrez-auth-token?serial_num=YOURSERIALNUMBER


Once I have generated the token, I will secure it in the /config/secrets.yaml file of home assistant by adding the line
enphase_api: "Bearer 408CharacterToken"
Note: please don’t forget to keep “Bearer “ in the front of the token or it will fail
Now that I have a 12 month token, I will start the process of setting up Home Assistant to obtain this data using the REST/RESTful integration.
rest:
  - headers:
      Authorization: !secret enphase_api
    verify_ssl: False
    scan_interval: 15
    resource: https://envoy.local/ivp/meters/readings
    sensor:

      - name: "Power Production"
        value_template: >
            {% set value = value_json[0].activePower | int(0) %}
            {% if value  <= 5 -%}
                0
            {% elif is_state('sun.sun','below_horizon') %}
                0
            {%- else -%}
                {{ value }}
            {%- endif %}
        device_class: power
        unit_of_measurement: W
        state_class: measurement
        icon: mdi:solar-panel

      - name: "Power Net"
        value_template: "{{ value_json[1].activePower | int(0) }}"
        state_class: measurement
        device_class: power
        unit_of_measurement: W
        icon: mdi:transmission-tower

      - name: "Energy Production"
        value_template: "{{ (value_json[0].actEnergyDlvd / 1000 | float(0)) | round(2) }}"
        device_class: energy
        unit_of_measurement: kWh
        state_class: total_increasing
        icon: mdi:solar-panel

      - name: "Energy Import"
        value_template: "{{ (value_json[1].actEnergyDlvd / 1000 | float(0)) | round(2) }}"
        device_class: energy
        unit_of_measurement: kWh
        state_class: total_increasing
        icon: mdi:transmission-tower

      - name: "Energy Export"
        value_template: "{{ (value_json[1].actEnergyRcvd / 1000 | float(0)) | round(2) }}"
        device_class: energy
        unit_of_measurement: kWh
        state_class: total_increasing
        icon: mdi:transmission-tower
This basically tells home assistant to visit https://envoy.local/ivp/meters/readings, ignore the self signed certifcate, use my 12 month token as authentication, and extract 5 pieces of information from a 5 kB reply, and do it every X seconds defined by the scan_interval.
The next thing I do is add the following 5 x template sensors to perform the calculations needed to fill in the gaps.
template:
  - sensor:
        name: Power Consumption
        state_class: measurement
        icon: mdi:home-lightning-bolt
        unit_of_measurement: W
        device_class: power
        state : >
          {{ states('sensor.power_production') | int(0) + states('sensor.power_net') | int(0) }}

  - sensor:
        name: Power Export
        state_class: measurement
        icon: mdi:transmission-tower
        unit_of_measurement: W
        device_class: power
        state : >
          {{ [0, states('sensor.power_production') | int(0) - states('sensor.power_consumption') | int(0) ] | max }}

  - sensor:
        name: Power Import
        state_class: measurement
        icon: mdi:transmission-tower
        unit_of_measurement: W
        device_class: power
        state : >
          {{ [0, states('sensor.power_consumption') | int(0) - states('sensor.power_production') | int(0) ] | max }}

  - sensor:
        name: Energy Net
        state_class: total
        icon: mdi:transmission-tower
        unit_of_measurement: kWh
        device_class: energy
        state : >
          {{ (states('sensor.energy_import') | float(0) - states('sensor.energy_export') | float(0)) | round(2) }}

  - sensor:
        name: Energy Consumption
        state_class: total
        icon: mdi:home-lightning-bolt
        unit_of_measurement: kWh
        device_class: energy
        state : >
          {{ (states('sensor.energy_production') | float(0) + states('sensor.energy_net') | float(0)) | round(2) }}
Note: Every time you modify the config/configuration.yaml file, you will have to reboot home assistant to load them at start up.
These 5 x template sensors will update the calculations at the same time that the 5 x rest sensors are updated every X seconds defined by the scan_interval.
Final result for 5 x Power sensors

Graph example

Final result for 5 x Energy sensors

Graph example (as these are lifetime figures, the increments are more subtle)

The thing I prefer about using these lifetime energy odometers is that they are direct from the Envoy and do not rely on the Reimann Sum Integration. No longer using Reimann Sum Integration will give energy dashboard more accuracy than before. For example, if I reboot home assistant, it wont miss out on any missing data.
Now, how do we get Energy dashboard to ingest this information?
We use an integration called utility_meter
I setup the following in /config/configuration.yaml
utility_meter:
  daily_energy:
    source: sensor.energy_import
    name: Daily Import
    cycle: daily
    tariffs:
      - OffPeak
      - Shoulder
      - Peak
  daily_energy_export:
    source: sensor.energy_export
    name: Daily Export
    cycle: daily
    tariffs:
      - buyback
How am I triggering the different tariffs?
I am using the following sensor to determine what tariff time it is right now.
  # Australian Ausgrid NSW Peak-shoulder-offpeak sensor defined
  # https://www.ausgrid.com.au/Your-energy-use/Meters/Time-of-use-pricing
  # Peak: 2pm - 8pm on working weekdays 1 November - 31 March;
  # Peak: 5pm - 9pm on working weekdays 1 June - 31 August
  # Off-peak: 10pm - 7am
  # Shoulder: all other times
  - sensor:
      name: TOU Period
      icon: mdi:clock-time-three-outline
      state: >
        {% set tou_period = 'shoulder' %}
        {% set n_month = now().month %}
        {% set n_hour = now().hour %}
        {% set is_summer = (n_month <= 3 or n_month >= 11) %}
        {% set is_winter = (6 <= n_month <= 8 ) %}
        {% if n_hour >= 22 or n_hour < 7 %}
          {% set tou_period = 'offpeak' %}
        {% elif ((is_summer and (14 <= n_hour <= 19))
           or (is_winter and (17 <= n_hour <= 20)))
           and (is_state("binary_sensor.workday_sensor", "on")) %}
          {% set tou_period = 'peak' %}
        {% endif %}
        {{tou_period}}
Note: this sensor.tou_period uses the workday integration.
You will need to add this integration for sensor.tou_period to work properly.
I must give credit to @Muppetteer for showing me this.
Use this view to confirm it is working the way you like it.

I am then using the following 3 automations to trigger what tariff I want utility_meter to attribute the consumption to depending on the current value of sensor.tou_period.
/config/automations.yaml
- alias: Tariff Shoulder
  description: ''
  trigger:
  - platform: state
    entity_id:
    - sensor.tou_period
    to: shoulder
  condition: []
  action:
  - service: select.select_option
    data:
      option: Shoulder
    target:
      entity_id:
      - select.daily_energy
  mode: single

- alias: Tariff Offpeak
  description: ''
  trigger:
  - platform: state
    entity_id:
    - sensor.tou_period
    to: offpeak
  condition: []
  action:
  - service: select.select_option
    data:
      option: OffPeak
    target:
      entity_id:
      - select.daily_energy
  mode: single

- alias: Tariff Peak
  description: ''
  trigger:
  - platform: state
    entity_id:
    - sensor.tou_period
    to: peak
  condition: []
  action:
  - service: select.select_option
    data:
      option: Peak
    target:
      entity_id:
      - select.daily_energy
  mode: single
Graph Example showing the values of each tariff increasing at the correct time of day as well as being reset at midnight every night.

At this point, I could add these to Energy Dashboard in their current state, however I now want to calculate the costs.
I created the following input_number helpers.

and then setup the following sensor to change the tariff price whenever sensor.tou_period changed its state.
template:
  - sensor:
      - name: Tariff Price
        unit_of_measurement: AUD/kWh
        state: >
         {% if is_state('sensor.tou_period', 'peak') %}
           {{ states('input_number.peak') | float(0) * states('input_number.discount') | float(0) }}
         {% elif is_state('sensor.tou_period', 'shoulder') %}
           {{ states('input_number.shoulder') | float(0) * states('input_number.discount') | float(0) }}
         {% else %}
           {{ states('input_number.offpeak') | float(0) * states('input_number.discount') | float(0) }}
         {% endif %}

  - sensor:
      - name: Tariff Price Export
        unit_of_measurement: AUD/kWh
        state: >
                {{ states('input_number.feed_in') }}
Graph example

Now we can finally add the sensors to Energy Dashboard.
Go to Settings / Dashboards / Energy / Add Consumption
Individually add these 3 sensors, each with sensor.tariff_price for the current price
sensor.daily_import_offpeak
sensor.daily_import_peak
sensor.daily_import_shoulder
Then for Add Return use sensor.daily_energy_export_buyback to use sensor.tariff_price_export for the current price
Then add Solar Production and choose sensor.energy_production
How it should look.

After a few hours, it should start to look like this

with a table like this

That should do it!
Hope this helps ![]()


