Is there a way to export the hourly data out of de HA energy dashboard towards CSV for example.
I would like to export that data to run calculations with regard to dynamic pricing.
Is there a way to export the hourly data out of de HA energy dashboard towards CSV for example.
I would like to export that data to run calculations with regard to dynamic pricing.
That would be very nice 
It’s been a couple years since this post. Any chance this has actually happened?
Bump.
Has a way been developed to extract the historical hourly interval data used by the energy dashboard?
Would be really nice i am now sitting and stringing into the SQL database but have not figured it out yet 
There is a custom card that can do CSV exports for long-term statistics:
Thanks but I don’t understand how that helps to export data from the Energy Dashboard.
The energy dashboard just displays long-term statistics (state_class: total or total_increasing) in nice graphs.
Thanks again but I’m not making the link.
How do I export historical interval data from the energy dashboard?
Let’s say I want to export my gas usage.
In Settings > Dashboards > Energy > Gas Consumption, I can see that the entity used to generate the gas usage graph is sensor.kotlik_gas_flow_integral.
After installing the custom card, add it to a dashboard:
type: custom:history-explorer-card
cardName: historycard-10713360
statistics:
  enabled: true
graphs:
  - type: line
    entities:
      - entity: sensor.kotlik_gas_flow_integral
Use the interactive zoom controls to select the time period that you want to export.
Press “Export statistics as CSV” in the menu (V next to the entity search box).
You should get a CSV file like this:
Time stamp,State,Mean,Min,Max
sensor.kotlik_gas_flow_integral
2022-10-11 12:00:00,1366.448,,,
2022-10-11 13:00:00,1366.448,,,
2022-10-11 14:00:00,1366.448,,,
2022-10-11 15:00:00,1366.448,,,
2022-10-11 16:00:00,1366.828,,,
2022-10-11 17:00:00,1366.828,,,
...
Got it. Thanks!
I was able to get this data from the console as well via the websocket API. For example, I used websocat and python. A quick snippet for those comfortable with cli:
websocat ws://my.ip.ad.dr:8123/api/websocket
Then paste in:
{"type": "auth","access_token": "super long HA long lived access here"}
After that auth’s, you can paste in:
{"type":"recorder/statistics_during_period","start_time":"2024-01-21T08:00:00.000Z","end_time":"2024-01-22T07:59:59.999Z","statistic_ids":["sensor.grid_import_energy","sensor.grid_import_energy_cost","sensor.grid_export_energy","sensor.grid_export_energy_compensation"],"period":"hour","units":{"energy":"kWh"},"types":["change"],"id":1}
Change the sensor names, dates, etc to suit your needs obviously.
For python I used Examples — websocket-client 1.7.0 documentation and just expanded on the first example with those same payloads above. If you go this route, know you need to ws.recv() right after connecting (before sending the auth payload).
As of 2024.2, you can download a csv file in the history dashboard. It does contain long-term statistics, but there seems to be only one of the values (i.e. mean/state, but no min nor max).
This is a step in the right direction, but the format it exports isn’t the best, its all one row of data, not columns with the hours. I also don’t know how you can do that per month, looks like after a couple of days you lose the individual hours…
its all one row of data, not columns with the hours
That is how all .csv data export is done, it is a universally usable text file, and not limited to specific programs that happen to use colums.
You need to use the import settings in your program to divide the data into columns, set the corret date format, delimiters etc. For example in Excel, Data → Get Data → From file → From text/CSV.
Did you figure out the time interval? I only started HA a few days ago, so I dont have much data, but if I export a month, I get the same data interval as if I export a day. But it does look like it doesnt save data for example every hour, but instead only if there is a change in the value.
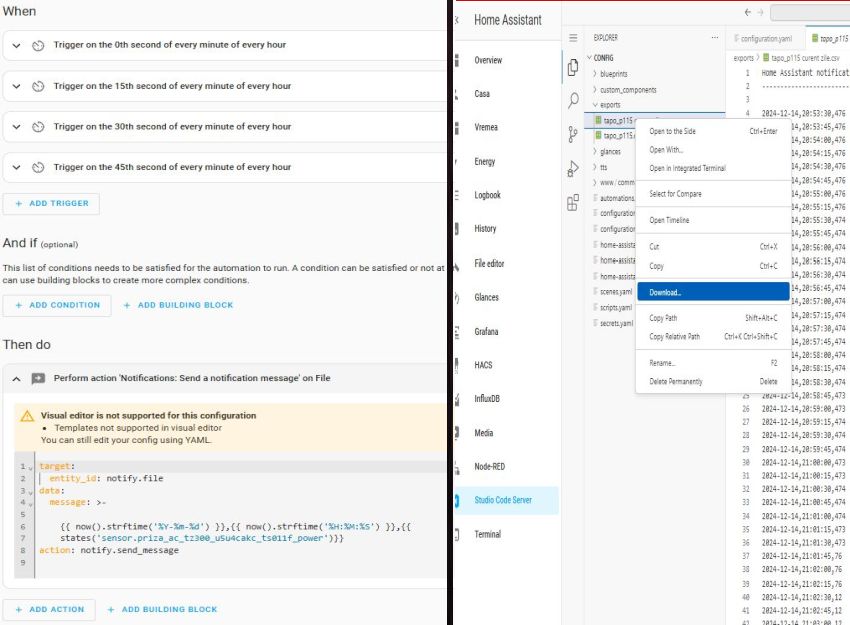
One way to export data in .csv format is to create an automation, like this one, with “File” integration:
The .csv file opens with Excel but the format for “date” must be changed to display correctly:
And the final result:
I’m not good at programming, I did this with the help of friends.
I’m still trying to save data for a month, but I can’t at the moment…
“I’m sorry but I can’t attach more than one image, I’ve linked to the other images.”