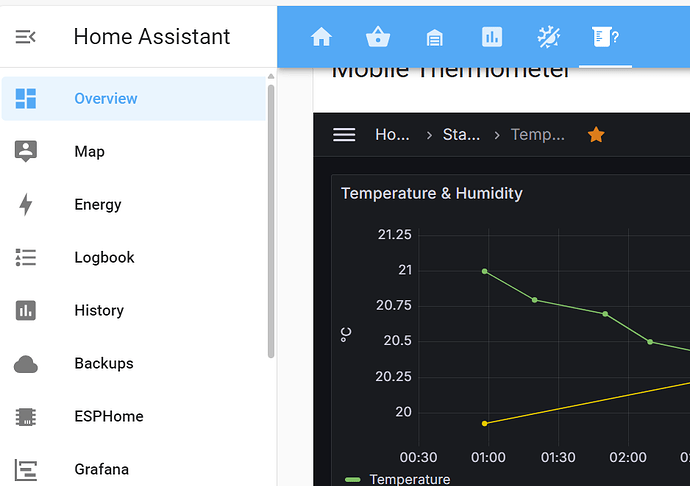
I have a Grafana graph that I have shared via a link and snapshot. I have pasted both links to the HomeAssistant dashboard using Webpage Cards.
If I have opened the Graphana UI during my session then the graphs display on the HomeAssistant dashboard, if not I then get a “401: Unauthorised” error for both.
If I then go back to the Graphana UI
and then straight back to the HomeAssistant dashboard, the graphs display correctly.
Not sure why this is or how to fix it.


