Posting this in case it helps someone…
Summary: If your HA setup is exhibiting strange behavior, check your memory usage. HA seems to go berserk when it runs out of memory.
I’ve been running HA on a RPi for several years, and it has been mostly working fine. Lately HA has been acting very strangely at times. Impossible entities appearing out of nowhere (see screenshot below), actions that just wouldn’t work any more, devices disappearing and needing to be re-added to HA, automations that fail to run. Lots of strange stuff. After doing recommended fixes, like putting my ZWave/Zigbee stick on a cable to get it far away from interference, strange things still kept happening. In all cases, restarting HA didn’t seem to help. Eventually HA would just “hang” and nothing would work.
However, simply power cycling the RPi always seemed to bring HA back to a working state. Artifacts of the strange behavior might remain, e.g., the weird entities that some devices had somehow acquired. Those entities were all “no longer provided by the integration” and could be deleted. But in a day or so, they’d reappear on their own.
I’ve worked in hardware and software for several decades, so I was curious to find out what was going on.
Eventually I noticed, using HA’s System>Hardware screen, that the RPi memory usage was pretty high. Immediately after power on, it would be around 85% utilized. But over the next 24 hours or so, it would slowly climb until it was near 95% utilization.
When the memory utilization got into the mid-90s, the strange behavior started to happen. Within a few hours, HA would still be running, but had become totally unresponsive. Automations didn’t run, GUI wouldn’t work even to do a shutdown or reboot.
That sounded to me like a memory problem, and something in HA was not behaving well when it couldn’t get additional memory it wanted.
As HA has evolved with lots of new features, new integrations, new toys, I had added things to my HA setup. Lots of things… So I wondered if my HA was just overloaded. I went through all my integrations, and "disable"d all but the core ZWave and Zigbee elements, especially the ONVIF and Reolink integrations which I thought might be memory intensive.
On reboot, HA memory usage was now at about 75%, and it ran for several days without any strange behavior.
My conclusion – HA doesn’t handle “out of memory” well, and doesn’t offer any warning when memory is becoming a problem. When memory runs out, all sorts of weird things can happen.
My RPi was a 3B, which has 1GB of memory. Thanks to a helpful neighbor, who had a spare RPi 4, with 8GB memory, I moved my HA over to the RPi4, with 8GB memory and an SSD disk instead of SD card. I used the guidance here, which worked great:
HA on the RPi4 works fine. I moved my old HA using the backups and ran for a day to make sure it worked. Then I re-enabled all the integrations I had disabled. After a few days, everything is still working. Memory usage, on the 8GB RPi4, is at 1.1GB – which probably explains why HA was having trouble running on my 1GB RPi3.
Bottom line – if you’re having HA problems that you can’t explain, check your memory usage!
Good luck,
Jack Haverty
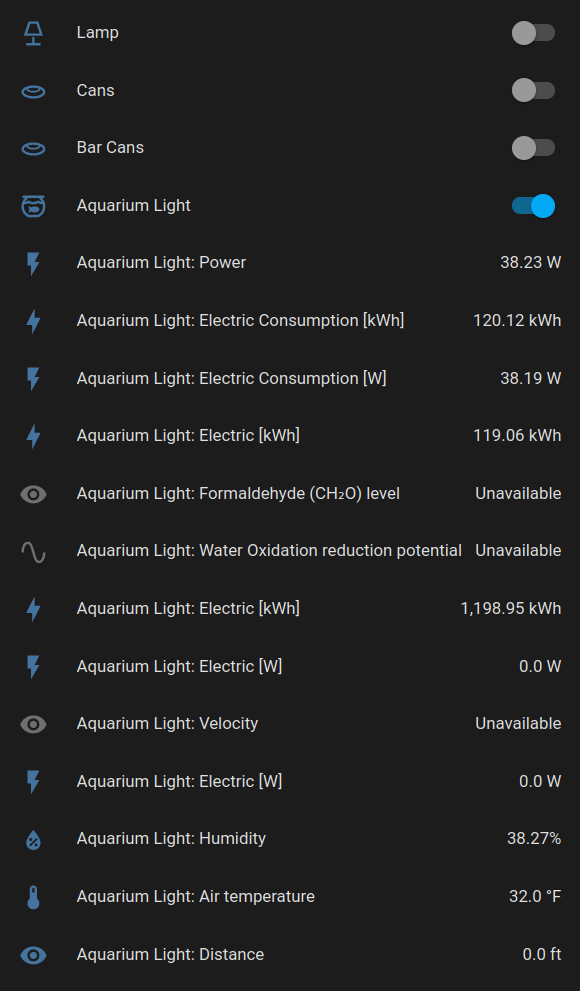
---- example of weird entities —
Running HA with over 100 devices, mostly ZWave but some Zigbee and MQTT. Using ZWave-JS-UI on a Raspberry Pi 3B+ with HUSBZB-1. Lots of other integrations - ONVIF, Reolink, Sonus, Roku, Cast, etc. All component software is at the latest release.
Strange entities appeared on the dashboard - things that the device doesn’t have. I have an Aeon “Smart Energy Switch” ( Z-Wave JS Config DB Browser ). It’s been working for years, and the expected controls (on/off) work, but recently it somehow acquired additional strange entities. Here’s a screenshot: