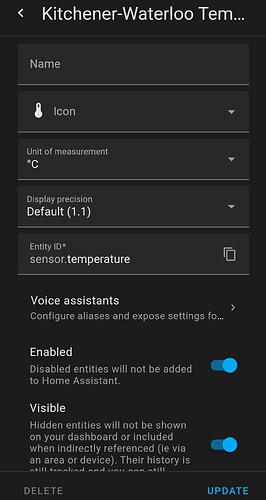
I’m trying to get the mini-graph from @pcwii card from this thread
My problem is my mini-graph is blank. I don’t have an entity sensor.temperature like in pcwii’s example, so I substituted sensor.toronto_temperature. Any suggestions?
My YAML looks like this:
type: custom:vertical-stack-in-card
cards:
  - type: markdown
    title: Forecast
    content: >
      ### <font color='#EEA056'> {{ states('sensor.toronto_summary') }} </font>
      <font color='#FF0000'>    {% if states('sensor.warnings') == '1' %}
        {{ state_attr('sensor.warnings', 'alert_1') }}
      {% elif states('sensor.warnings') == '2' %}
        {{ state_attr('sensor.warnings', 'alert_1') }}
        {{ state_attr('sensor.warnings', 'alert_2') }}
      {% elif states('sensor.warnings') == '3' %}
        {{ state_attr('sensor.warnings', 'alert_1') }}
        {{ state_attr('sensor.warnings', 'alert_2') }}
        {{ state_attr('sensor.warnings', 'alert_3') }}
      {% else %}
        {{ '' }}
      {% endif %} </font>
  - type: custom:weather-card
    entity: weather.toronto
    name: Now
  - type: custom:mini-graph-card
    hours_to_show: 72
    show:
      labels: true
      labels_secondary: true
      icon: false
      name: false
      state: false
      align_state: right
      font_size: 50
    color_thresholds:
      - value: -5
        color: '#6499f7'
      - value: 10
        color: '#8ff95d'
      - value: 22
        color: '#e89e4b'
      - value: 28
        color: '#df4b3e'
    entities:
      - sensor.toronto_temperature


