hey Ben, did you ever get this working?
Sorry, no. I gave up  .
.
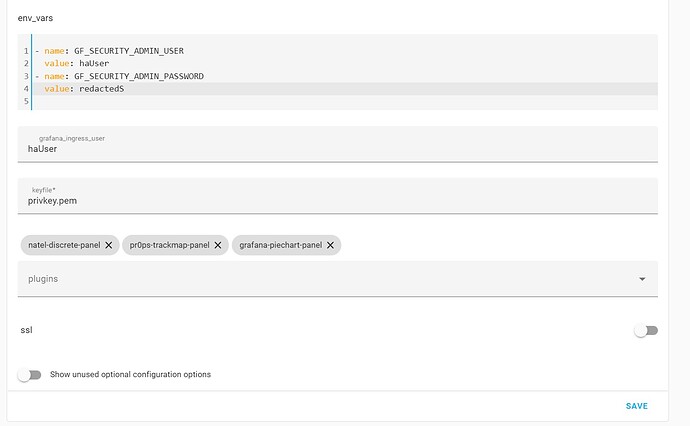
The Add-On in HA has a “Documentation” page. It explains how you can use env_vars for configuring Grafana. Any setting that can be written into the ini file can also be written as an environment variable:
After upgrading to v8.0.1 my dashboards are not working anymore. I get the following error messages for all data sources:
Any ideas what is going wrong? Worked perfectly before. Thank you!
Getting the exact same problem…
Fixed it: in Grafana, go to Configuration - Data Sources and rewrite your password in the password field, no idea why this has happened, must have been something related to upgrading to a new major version of Grafana.
Thanks a lot! That fixed it for me, too.
I have having an issue with the Grafana alerts which is driving me mad and I am hoping that someone here knows the solution.
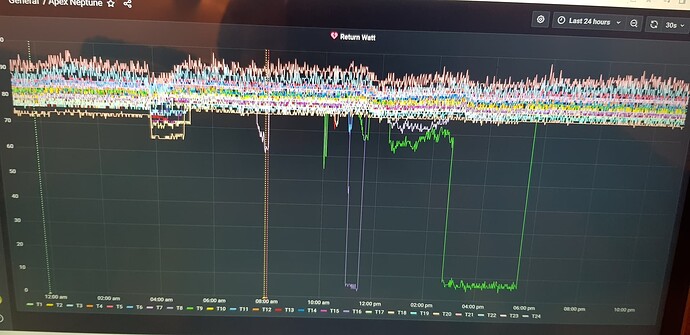
I have created an alert in Grafana that triggers and is shown as fired, all good so far. However any subsequent alert is not fired. I can see no reason why another alarm condition does not generate another alter. see attached picture
In addition when the initial fault is recitified the Grana alert icon on the graph panel is still showing the red broken heart. See attached picture.
In reading the grafana docs there seem to be several alerting features that the HA version doesnt have and I wondered if this is correct or I am just looking in the wrong place (attach an image when sending the alert, pausing an alert are two that I would like to use)
I configured Alerting contact points with an email notification in Grafana several months ago and when an alert was triggered it fired off an email notification and it worked like a dream. But as I was busy I turned this feature off. Today I have come back and reactivated email alerts but I now receive a message stating the emails could not be sent.
When configuring contact points you have the ability to test the send notification and get a confirmation the email has been sent.
However now I receive the message “failed to send test alert: failed to send notification to email addresses: [email protected] EOF:”
([email protected] replaces real email address)
My Grafana smtp configuration uses gmail and I use the Google app authentication. This has been tested using another service and the gmail service works as expected.
The Grafana error log shows the following message after the test send notification in contact points has been clicked.
logger=alertmanager org=1 t=2022-10-25T18:40:00.801001279+01:00 level=error component=dispatcher msg="Notify for alerts failed" num_alerts=1 err="grafana-default-email/email[0]: notify retry canceled due to unrecoverable error after 1 attempts: failed to send notification to email addresses: [[email protected]](mailto:[email protected]): EOF"
My Grafana config is as follows:
env_vars

* name: GF_SMTP_ENABLED
value: "true"
* name: GF_SMTP_HOST
value: smtp.gmail.com:587
* name: GF_SMTP_USER
value: [[email protected]](mailto:[email protected])
* name: GF_SMTP_PASSWORD
value: mypassword
* name: GF_SMTP_SKIP_VERIFY
value: "true"
* name: GF_SMTP_FROM_ADDRESS
value: [[email protected]](mailto:[email protected])
* name: GF_SMTP_FROM_NAME
value: GRAFANA
any ideas as to the problem?
Hey @frenck I love the plugin, but configuring grafana and influx can go wrong in so many ways! Have you ever thought about provisioning a default influxdb datasource in your grafana plugin?
Hi,
I am struggling installing/ configuring Grafana in HAOS. I get an “Unknow error…” when I click on Plugins in Configuration: “The filter has been disabled because the Grafana server cannot access grafana.com”. The only thing I can think of is that my user credentials somehow are set up wrong. Maybe I can get some help here?
Here is some info:
s6-rc: info: service s6rc-oneshot-runner: starting
s6-rc: info: service s6rc-oneshot-runner successfully started
s6-rc: info: service fix-attrs: starting
s6-rc: info: service fix-attrs successfully started
s6-rc: info: service legacy-cont-init: starting
cont-init: info: running /etc/cont-init.d/00-banner.sh
Add-on: Grafana
The open platform for beautiful analytics and monitoring
Add-on version: 8.0.2
You are running the latest version of this add-on.
System: Home Assistant OS 9.3 (aarch64 / odroid-n2)
Home Assistant Core: 2022.11.0
Home Assistant Supervisor: 2022.10.0
Please, share the above information when looking for help
or support in, e.g., GitHub, forums or the Discord chat.
cont-init: info: /etc/cont-init.d/00-banner.sh exited 0
cont-init: info: running /etc/cont-init.d/01-log-level.sh
logger=auth.proxy t=2022-11-03T12:16:46.134819825+01:00 level=debug msg=“Trying to log user in” username=haUser ignoreCache=false
logger=auth.proxy t=2022-11-03T12:16:46.135061667+01:00 level=debug msg=“Getting user ID via auth cache” cacheKey=auth-proxy-sync-ttl:dfc5525e683c64bf6ef7b2dd75e53c7d
logger=auth.proxy t=2022-11-03T12:16:46.135591894+01:00 level=debug msg=“Successfully got user ID via auth cache” id=1
logger=auth.proxy t=2022-11-03T12:16:46.135714482+01:00 level=debug msg=“Got user ID, getting full user info” userID=1
logger=auth.proxy t=2022-11-03T12:16:46.136982443+01:00 level=debug msg=“Successfully got user info” userID=1 username=haUser
logger=ngalert t=2022-11-03T12:16:50.005233553+01:00 level=debug msg=“alert rules fetched” count=0
logger=auth.proxy t=2022-11-03T12:16:53.304709312+01:00 level=debug msg=“Trying to log user in” username=haUser ignoreCache=false
logger=auth.proxy t=2022-11-03T12:16:53.304908777+01:00 level=debug msg=“Getting user ID via auth cache” cacheKey=auth-proxy-sync-ttl:dfc5525e683c64bf6ef7b2dd75e53c7d
logger=auth.proxy t=2022-11-03T12:16:53.308413026+01:00 level=debug msg=“Successfully got user ID via auth cache” id=1
logger=auth.proxy t=2022-11-03T12:16:53.308683952+01:00 level=debug msg=“Got user ID, getting full user info” userID=1
logger=auth.proxy t=2022-11-03T12:16:53.314884546+01:00 level=debug msg=“Successfully got user info” userID=1 username=haUser
logger=context traceID=00000000000000000000000000000000 userId=1 orgId=1 uname=haUser t=2022-11-03T12:16:53.322568858+01:00 level=debug msg=“Updating last user_seen_at” user_id=1
logger=ngalert t=2022-11-03T12:16:59.996621615+01:00 level=debug msg=“recording state cache metrics” now=2022-11-03T12:16:59.996576697+01:00
logger=ngalert t=2022-11-03T12:17:00.001581373+01:00 level=debug msg=“alert rules fetched” count=0
logger=secrets t=2022-11-03T12:17:00.224303563+01:00 level=debug msg=“Removing expired data keys from cache…”
logger=secrets t=2022-11-03T12:17:00.224457777+01:00 level=debug msg=“Removing expired data keys from cache finished successfully”
logger=alerts-router t=2022-11-03T12:17:00.294346076+01:00 level=debug msg=“start of admin configuration sync”
logger=alerts-router t=2022-11-03T12:17:00.294825551+01:00 level=debug msg=“found admin configurations” count=0
logger=alerts-router t=2022-11-03T12:17:00.294869844+01:00 level=debug msg=“finish of admin configuration sync”
logger=ngalert.multiorg.alertmanager t=2022-11-03T12:17:00.299209456+01:00 level=debug msg=“synchronizing Alertmanagers for orgs”
logger=alertmanager org=1 t=2022-11-03T12:17:00.30104202+01:00 level=debug msg=“neither config nor template have changed, skipping configuration sync.”
logger=ngalert.multiorg.alertmanager t=2022-11-03T12:17:00.301968511+01:00 level=debug msg=“done synchronizing Alertmanagers for orgs”
logger=auth.proxy t=2022-11-03T12:17:08.508997648+01:00 level=debug msg=“Trying to log user in” username=haUser ignoreCache=false
logger=auth.proxy t=2022-11-03T12:17:08.509111068+01:00 level=debug msg=“Getting user ID via auth cache” cacheKey=auth-proxy-sync-ttl:dfc5525e683c64bf6ef7b2dd75e53c7d
logger=auth.proxy t=2022-11-03T12:17:08.509715965+01:00 level=debug msg=“Successfully got user ID via auth cache” id=1
logger=auth.proxy t=2022-11-03T12:17:08.509789342+01:00 level=debug msg=“Got user ID, getting full user info” userID=1
logger=auth.proxy t=2022-11-03T12:17:08.510791628+01:00 level=debug msg=“Successfully got user info” userID=1 username=haUser
logger=auth.proxy t=2022-11-03T12:17:08.536569995+01:00 level=debug msg=“Trying to log user in” username=haUser ignoreCache=false
logger=auth.proxy t=2022-11-03T12:17:08.536664915+01:00 level=debug msg=“Getting user ID via auth cache” cacheKey=auth-proxy-sync-ttl:dfc5525e683c64bf6ef7b2dd75e53c7d
logger=auth.proxy t=2022-11-03T12:17:08.537584198+01:00 level=debug msg=“Successfully got user ID via auth cache” id=1
logger=auth.proxy t=2022-11-03T12:17:08.537676909+01:00 level=debug msg=“Got user ID, getting full user info” userID=1
logger=auth.proxy t=2022-11-03T12:17:08.539155961+01:00 level=debug msg=“Successfully got user info” userID=1 username=haUser
logger=auth.proxy t=2022-11-03T12:17:08.546675768+01:00 level=debug msg=“Trying to log user in” username=haUser ignoreCache=false
logger=auth.proxy t=2022-11-03T12:17:08.546802398+01:00 level=debug msg=“Getting user ID via auth cache” cacheKey=auth-proxy-sync-ttl:dfc5525e683c64bf6ef7b2dd75e53c7d
logger=auth.proxy t=2022-11-03T12:17:08.54733775+01:00 level=debug msg=“Successfully got user ID via auth cache” id=1
logger=auth.proxy t=2022-11-03T12:17:08.547411336+01:00 level=debug msg=“Got user ID, getting full user info” userID=1
logger=auth.proxy t=2022-11-03T12:17:08.548808885+01:00 level=debug msg=“Successfully got user info” userID=1 username=haUser
logger=ngalert t=2022-11-03T12:17:10.001022073+01:00 level=debug msg=“alert rules fetched” count=0
logger=ngalert t=2022-11-03T12:17:14.996412632+01:00 level=debug msg=“recording state cache metrics” now=2022-11-03T12:17:14.996388257+01:00
logger=ngalert t=2022-11-03T12:17:20.002088143+01:00 level=debug msg=“alert rules fetched” count=0
After the installation of Grafana I also need to install Teslamate Add-on. Here I set Grafana user credentials because some preconfigured dashboards need to be installed while Teslamate is startet. But the Dashboards never lands in Grafana. So - what to do?
Hello all,
I’m new to Grafana
I’m using Grafana with influxDB as Home Assistant add-ons and want to display some dashboards directly on a screen using digital signage software. I read about public dashboards and wanted to use them but it does not appear for me as an option(like sharing with links or snapshots) and i didn’t know how to enable them.
is there an easy way to share dashboards live with updated data ?
thanks a lot
fsl
Hi all,
i want to enable the sharing feature “Public Dashboard” as descripted here Share Grafana dashboards outside your organization with Grafana 9.1
can someone help me with this please?
Thanks in advance!
fsl
Did you find out?
Why do i need to save the data a second time with influx DB?
You already have historical data in hass can’t you directly acess it with grafana?
Can anyone help me understand the problem here while trying to save any new dashboard? Last week everything was working correctly but now it’s always showing this when creating new dashboards.
It’s also showing this message in my integrated Web Pages cards in HA:
Need help here, thanks!
Somehow my password changed ( for the second time). Anyone who can help me ?
I logged in with putty to root and then used this code : docker exec -ti <container_name> grafana-cli admin reset-admin-password mypass@123 . I get the message that my admin pass is changed, but I cant log in with it …
If anyone meets this problem, here is the solution that worked for me:
Simply click “sign out” on the admin account in the add-on(bottom left user icon)
I’m trying to set up smtp notifications in Grafana to alert me via email when certain thresholds have been met. I’ve digested all the documentation and other people’s articles on this matter and then entered the following into env_vars:
plugins: []
env_vars:
name: GF_SMTP_ENABLED
value: 'true'
name: GF_SMTP_HOST
value: 'smtp.gmail.com:587'
name: GF_SMTP_USER
value: '[email protected]'
name: GF_SMTP_PASSWORD
value: 'mypassword'
name: GF_SMTP_SKIP_VERIFY
value: 'true'
name: GF_SMTP_FROM_ADDRESS
value: '[email protected]'
name: GF_SMTP_FROM_NAME
value: 'GRAFANA'
ssl: true
certfile: fullchain.pem
keyfile: privkey.pem
However, when I save the configuration I get the following error:
“Failed to save add-on configuration, Missing option ‘env_vars’ in root in Grafana (a0d7b954_grafana). Got {‘certfile’: ‘fullchain.pem’, ‘keyfile’: ‘privkey.pem’, ‘plugins’: [], ‘ssl’: False}”
I’ve tried various versions of the env_vars text input but always get the same result. What is going wrong?
I am having issues installing plugins via the gui.
Everytime i paste anything into the “plugin field”, then it disappears as soon as I change focus from that input field. And the save button is still unavailable. Anyone who can help me here?
EDIT:
Found out that I could press the three dots in the right corner and edit in yaml
Hello, I just installed the 8.2.0 update and several of my graphs stopped working. They are giving and error about influx DB and to check the grafana server logs. Any ideas?


