Home Assistant Core shutting down unexpectedly

Hello! This is not strictly about installation, but because I’m running “Home Assistant Supervised”, this seemed to be the best topic to post the question. Here it is:

Recently the Core in my HA install stared shutting down on it’s own, without any errors. Can’t figure out the reason. I’ll post the logs from HA core and supervisor below.

Environment information:

arch: armv7
channel: stable
docker: 20.10.8
features:
- reboot
- shutdown
- services
- network
- hostname
- timedate
hassos: null
homeassistant: 2021.11.5
hostname: homeassistant
logging: info
machine: raspberrypi3
operating_system: Raspbian GNU/Linux 10 (buster)
state: running
supervisor: 2021.10.8
supported: false
supported_arch:
- armv7
- armhf

Logs from HA core: (truncated)

2021-11-26 19:09:00 WARNING (Thread-2) [homeassistant.helpers.template] Template variable warning: 'None' has no attribute 'last_changed' when rendering or compiling ''
[finish] process exit code 256
[finish] process received signal 9
[finish] process exit code 256
[finish] process received signal 15
[cont-finish.d] executing container finish scripts...
[cont-finish.d] done.
[s6-finish] waiting for services.
[s6-finish] sending all processes the TERM signal.
[s6-finish] sending all processes the KILL signal and exiting.
pi@homeassistant:~ $

Logs from HA supervisor: (truncated)

21-11-29 14:17:19 INFO (MainThread) [supervisor.api.middleware.security] /supervisor/info access from cebe7a76_hassio_google_drive_backup
21-11-29 14:17:19 INFO (MainThread) [supervisor.api.middleware.security] /backups access from cebe7a76_hassio_google_drive_backup
21-11-29 14:31:56 INFO (MainThread) [supervisor.updater] Fetching update data from https://version.home-assistant.io/stable.json
21-11-29 14:32:34 INFO (MainThread) [supervisor.resolution.check] Starting system checks with state CoreState.RUNNING
21-11-29 14:32:34 INFO (MainThread) [supervisor.resolution.checks.base] Run check for IssueType.TRUST/ContextType.SUPERVISOR
21-11-29 14:32:34 INFO (MainThread) [supervisor.resolution.checks.base] Run check for IssueType.PWNED/ContextType.ADDON
21-11-29 14:32:34 INFO (MainThread) [supervisor.resolution.checks.base] Run check for IssueType.TRUST/ContextType.CORE
21-11-29 14:32:34 INFO (MainThread) [supervisor.resolution.checks.base] Run check for IssueType.FREE_SPACE/ContextType.SYSTEM
21-11-29 14:32:34 INFO (MainThread) [supervisor.resolution.checks.base] Run check for IssueType.SECURITY/ContextType.CORE
21-11-29 14:32:34 INFO (MainThread) [supervisor.resolution.checks.base] Run check for IssueType.TRUST/ContextType.PLUGIN
21-11-29 14:32:34 INFO (MainThread) [supervisor.resolution.check] System checks complete
21-11-29 14:32:34 INFO (MainThread) [supervisor.resolution.evaluate] Starting system evaluation with state CoreState.RUNNING
21-11-29 14:32:34 INFO (MainThread) [supervisor.resolution.evaluate] System evaluation complete
21-11-29 14:32:34 INFO (MainThread) [supervisor.resolution.fixup] Starting system autofix at state CoreState.RUNNING
21-11-29 14:32:34 INFO (MainThread) [supervisor.resolution.fixup] System autofix complete
pi@homeassistant:~ $

dmesg logs: (truncated)

[103321.198028] Mem-Info:
[103321.198044] active_anon:103060 inactive_anon:103087 isolated_anon:0
                 active_file:41 inactive_file:1704 isolated_file:96
                 unevictable:4 dirty:0 writeback:0
                 slab_reclaimable:6170 slab_unreclaimable:6773
                 mapped:164 shmem:5536 pagetables:2467 bounce:0
                 free:4054 free_pcp:434 free_cma:40
[103321.198057] Node 0 active_anon:412240kB inactive_anon:412348kB active_file:164kB inactive_file:6816kB unevictable:16kB isolated(anon):0kB isolated(file):384kB mapped:656kB dirty:0kB writeback:0kB shmem:22144kB writeback_tmp:0kB kernel_stack:6024kB all_unreclaimable? no
[103321.198072] DMA free:16216kB min:16384kB low:20480kB high:24576kB reserved_highatomic:0KB active_anon:412240kB inactive_anon:412348kB active_file:0kB inactive_file:7100kB unevictable:16kB writepending:0kB present:970752kB managed:945364kB mlocked:16kB pagetables:9868kB bounce:0kB free_pcp:1736kB local_pcp:248kB free_cma:160kB
[103321.198078] lowmem_reserve[]: 0 0 0
[103321.198103] DMA: 818*4kB (UMEC) 442*8kB (UMEC) 200*16kB (UME) 79*32kB (UME) 24*64kB (ME) 9*128kB (UME) 3*256kB (U) 2*512kB (M) 0*1024kB 0*2048kB 0*4096kB = 17016kB
[103321.198211] 7498 total pagecache pages
[103321.198219] 31 pages in swap cache
[103321.198226] Swap cache stats: add 232642, delete 232611, find 132050/171715
[103321.198232] Free swap  = 0kB
[103321.198237] Total swap = 307196kB
[103321.198243] 242688 pages RAM
[103321.198249] 0 pages HighMem/MovableOnly
[103321.198254] 6347 pages reserved
[103321.198260] 16384 pages cma reserved
[103321.198266] Tasks state (memory values in pages):
[103321.198272] [  pid  ]   uid  tgid total_vm      rss pgtables_bytes swapents oom_score_adj name
[103321.198299] [    118]     0   118    10347      215    83968      135             0 systemd-journal
(aproximately 180 lines cut out for brevity)
[103321.200126] [  18750]     0 18750     1090       33    10240        0             0 pgrep
[103321.200137] [  18758]     0 18758     1987       34    12288       12             0 cron
[103321.200147] [  18759]     0 18759     1987       30    12288       16             0 cron
[103321.200157] oom-kill:constraint=CONSTRAINT_NONE,nodemask=(null),cpuset=ab8434278066a72b90184009b898dd8308373da7619d1c745c7b5e5ff621f2b2,mems_allowed=0,global_oom,task_memcg=/,task=python3,pid=7218,uid=0
[103321.200313] Out of memory: Killed process 7218 (python3) total-vm:587660kB, anon-rss:352320kB, file-rss:0kB, shmem-rss:0kB, UID:0 pgtables:624kB oom_score_adj:0
[103321.381143] oom_reaper: reaped process 7218 (python3), now anon-rss:0kB, file-rss:0kB, shmem-rss:0kB
pi@homeassistant:~ $

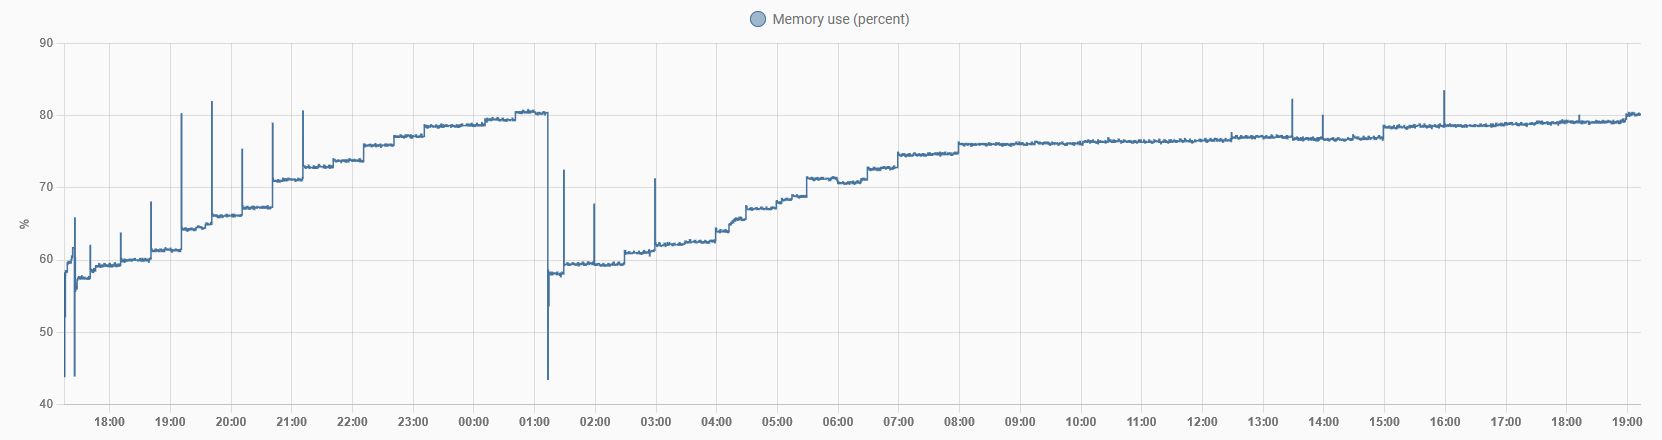
In the process of composing this post I noticed the “out of memory” error in dmesg (above), and this is likely why it is being shutdown. That never happened before, and started occurring after I updated last week.

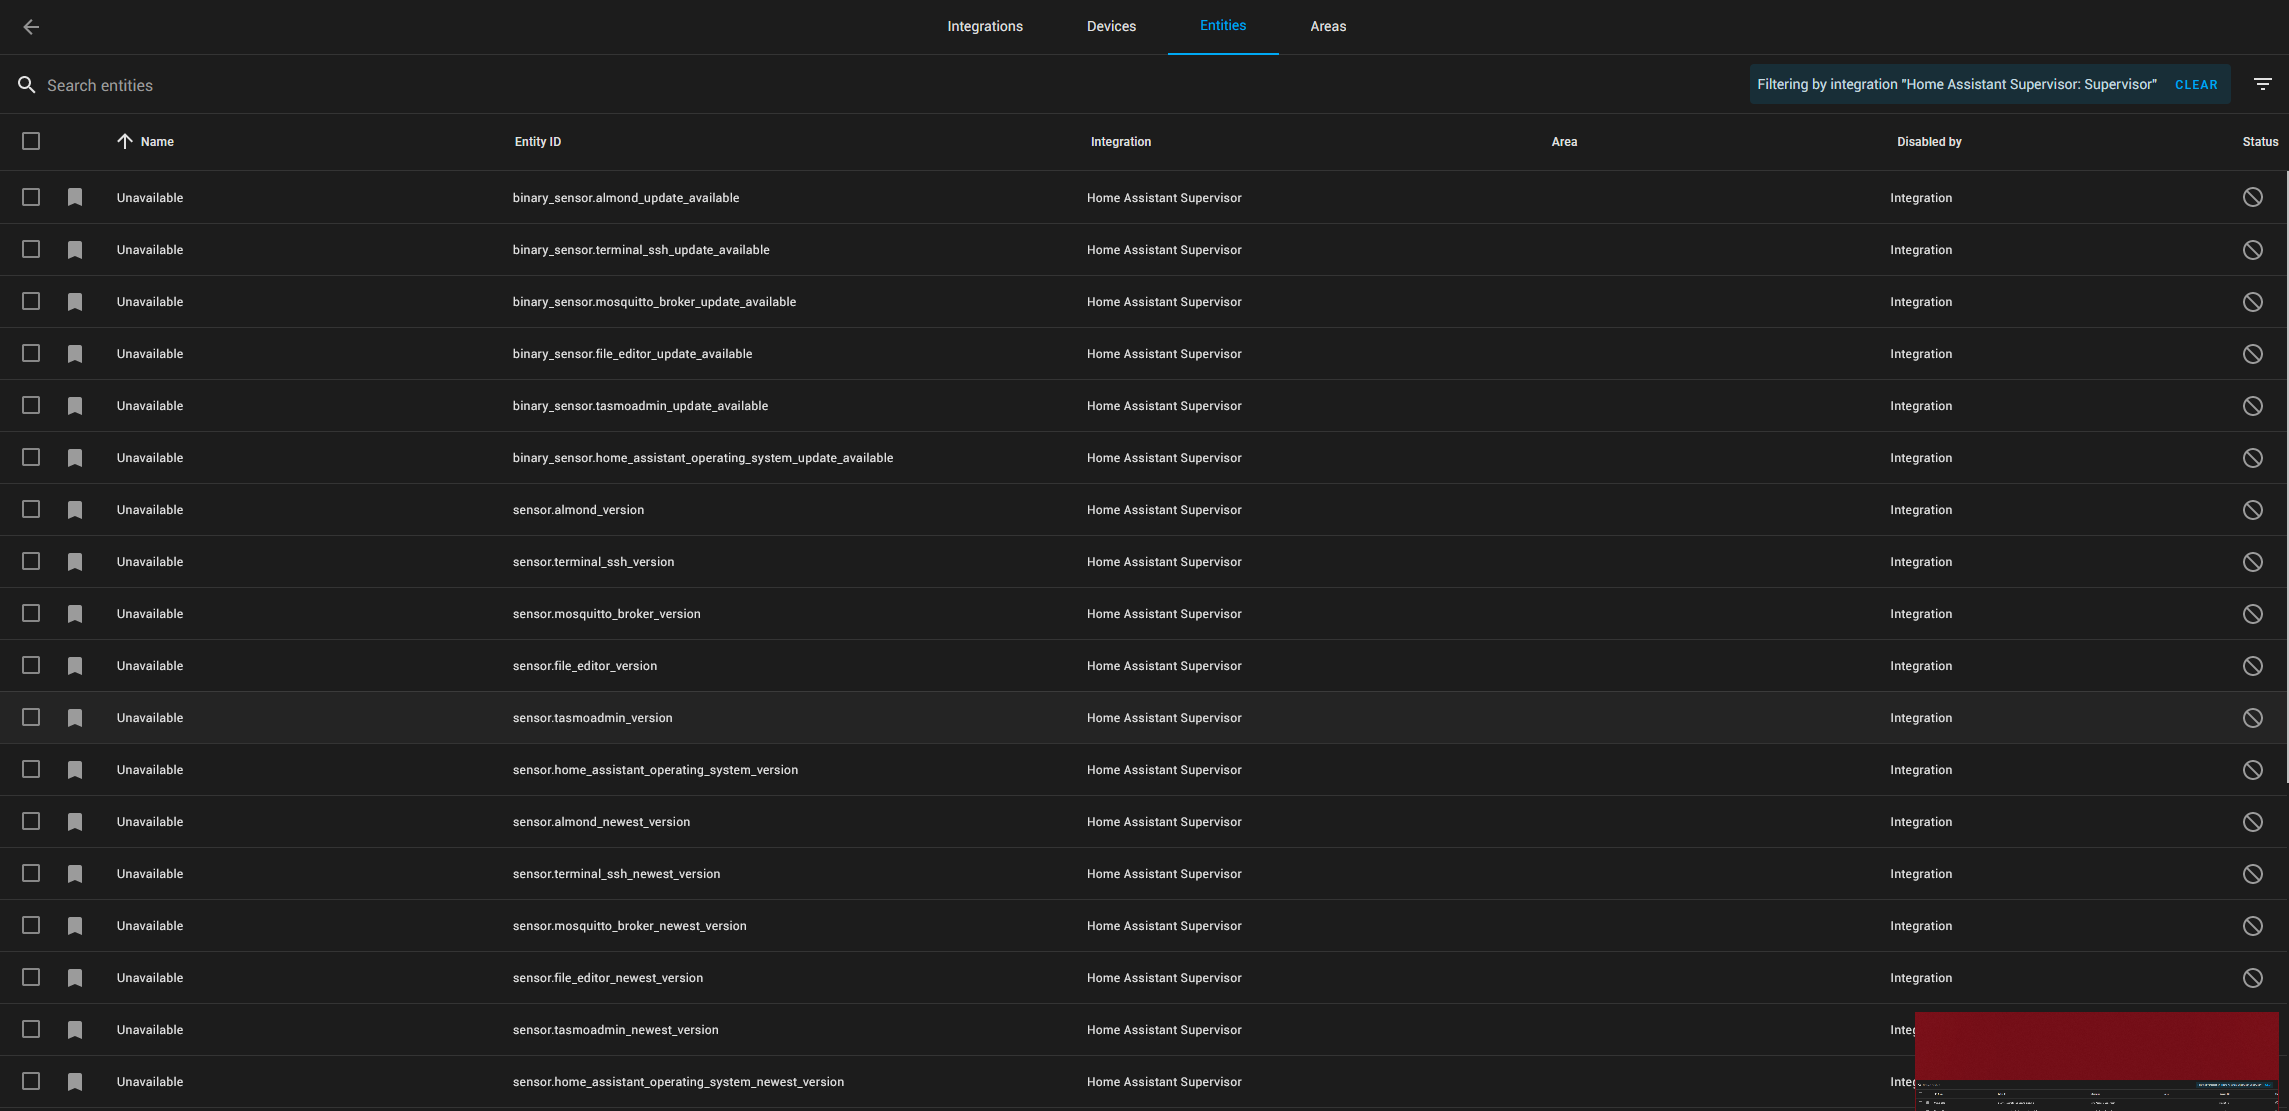
I will start disabling addons and generally trying to figure out if there’s a memory leak somewhere.

Have anyone seen any memory usage issues lately?

thanks!
Claudio

harddrive

I had and old lappie drive (been cheap) in my nuc and it would die take a loonnnnnnnnng time to start. all sort of funny thing

brought a new drive SSD and shit has not miss a beat.

Rather than focusing individual add-ons, i would focus on integrations. Add-ons and core are independent docker containers, so they should not impact each other (hopefully)

Ah, that makes sense and it’s good advice!. Will poke at integrations first and see if I can find a likely culprit. Thanks.

I newer had issues with HA shutting down unexpectedly, but after reading this topic and looking at my memory sensor i can show you this:


There was a restart on 2021-11-22 around 9am and searching files that i edited that day shows me this:

(ha) homeassi:~$ find .homeassistant/ -type f -name "*.yaml" -newermt 2021-11-22 ! -newermt 2021-11-23
.homeassistant/configuration.yaml
.homeassistant/ui-lovelace/resources.yaml

Those files were changed for the new card-mod update.

Performance improvements

While card-mod can be installed as a lovelace resource, some functionality will benefit greatly from it being installed as a frontend module instead.

To do that, add the following to your configuration.yaml file and restart Home Assistant:

frontend: extra_module_url: - /local/card-mod.js

Could it be that a frontend module impacts the memory usage of HA?

EDIT: Sorry, false report.
Switching off the frontend module and also an older version of card-mod did not bring any improvement in memory usage.

I had some bad experience with streaming (video) inside home assistant frontend and moved into WebRTC. I don’t have anymore restart because of insufficient memory.

Quick update from my end:

  • I’ve added a cron whatchdog to monitor the running status of HA Core and restart if stopped; should allow me to keep tabs on how often it is happening
  • I also noticed that my Unify controller was using too much memory (I have it installed on the OS and not docker because the add-on is no longer supported on the PI 3)
  • Because my Unify setup is small, I constrained the controller to 256MB of memory (instructions here).

So far everything seems ok, but I’m monitoring. If I see no HA Core restarts in the next 24-48 hours I will again unconstrain the memory of the Unify controller to see if that makes a difference - just in order to understand the source of my problem.

All things considered, it might be time to get a PI 4 with more memory :slight_smile:

When there is a memory leak, it will eventually clog all available memory, independent of 2gb, 4gb or 8gb :slight_smile: so moving to pi 4 might help you with a faster home assistant but not for possible memory leak

Indeed, you are 100% correct!

Restricting the memory usage of Unify gave me a bit more room, but the problem is still there, my HA core is being killed (and restarted by my cron watchdog) about 2 or 3 hours.

Next step: trying to figure out which integration is the culprit.

I am having the exact same issue and had the core shutdown log messages.

My system is running as a VM on ESXi running HASS.io, I have allocated 8GB of RAM to the VM and it is always all used. I went looking for the memory sensor like I have seen in other posts in this thread but I don’t have any.

When I look at the sensors for the Supervisor integration, this is what I see:

Following this topic I have removed some of my add-ons and turned off a couple to see if it helps.

Like the others here, what could I do to look into this issue?

Cheers.

Far that you may need to add the systemmonitor to your configuration.yaml settings. Here’s how I have mine: (the relevant entry is memory_use_percent)

  # System monitor: CPU, Memory and disk:
  - platform: systemmonitor
    resources:
      - type: disk_use_percent
        arg: /
      - type: memory_use_percent
      - type: load_1m
      - type: swap_free
      - type: last_boot

Other than that I still got no news. My system is still leaking memory like crazy and rebooting about 5 times per day. I won’t re-install because I want to get to the bottom of this (and I believe if I reinstall the problem will resume the moment I reload my configuration). My issue is limited time for troubleshooting right now, so progress has been slow.

I’m facing a similar problem running “Home Assistant Operating System” on an Raspberry.

ha core info

arch: armv7
audio_input: None
audio_output: None
boot: true
image: ghcr.io/home-assistant/raspberrypi3-homeassistant
ip_address: 172.30.32.1
last_version: 2021.11.5
machine: raspberrypi3
port: 8123
ssl: false
update_available: false
version: 2021.11.5
version_latest: 2021.11.5
wait_boot: 600
watchdog: true

From time to time the core is killed (dmesg log):

[490097.468667] oom-kill:constraint=CONSTRAINT_NONE,nodemask=(null),cpuset=8c3f6268a481523b7ccdbb51bc5ce60eb78bcfa538c5f972c17faac9b7a1f4ae,mems_allowed=0,global_oom,task_memcg=/docker/af28f6138da59e1f0521f3b99804e99714f3245d01b80b01e14e54af13d4e13d,task=python3,pid=21448,uid=0
[490097.468798] Out of memory: Killed process 21448 (python3) total-vm:810524kB, anon-rss:575300kB, file-rss:2036kB, shmem-rss:0kB, UID:0 pgtables:822kB oom_score_adj:0
[490097.790387] oom_reaper: reaped process 21448 (python3), now anon-rss:0kB, file-rss:0kB, shmem-rss:0kB

My problems started about 2 weeks ago when i experimented with ESPhome. While i compiled my first yaml the core got killed. The second compile worked, but from then on my core gets killed about once a day. Removing ESPhome didn’t solve the issue, the core is still killed from time to time.
Yesterday, after reading this, i’ve actived the memory sensor and one can see that the memory usage increases constantly. I have a script running which restarts the core at 1:10 AM. This explains the drop at this time.

It seems as if a task running approx. every 30minutes doesn’t always terminate correctly. I will try if i can figure out which task has a problem.

Mine had crashed again overnight. So I rebooted the HOST via the Supervisor panel however this didn’t bring the host back to a working condition.

As I use ESXi I forced a shutdown on the machine as I was unable to do anything else with it, I gave it a moment and then started it back up again.

Now that it is back up and working again, I thought I would share the memory graph from my ESXi instance and my HASS VM:

You can see where I shutdown the VM and started it again.

Since putting the aforementioned monitors in place, the system only thinks it is using around 8.4% of memory, even when the VM thought it was using it all. I will monitor and report back.

Still doing some testing here on my end. I’ve disabled the Sppedtest and Waze integrations (saw both mentioned as memory-leak suspects elsewhere), and also removed some rather complex templates which had errors in it. That was on Dec 6th and you can see in the chart below that things immediately improved, no more restarts since then.

However, there is still an overall upwards trend in memory usage, if less pronounced, so I expect in another few days it will lockup / restart again.

Since then, yesterday I re-enabled Waze (you see that as a brief spike in the chart), and today I re-enabled Speedtest. Have not brought back the large template sensors, may try that next - I’m moving slowly to see if I can find a clear culprit.

image

If you have bad templates and use namespace, they can cause memory creep. Any template using states.sensor or just states will cause issues if you iterate over them constantly.

1 Like

Update 2021-12-16: after I had thought it had been solved by disabling SpeedTest (see below), there were two more instances of an unexpected restart caused by memory pressure. I’m currently observing it to see how it behaves.


Solution found: at least in my setup, the SpeedTest integration was the culprit. It was running with the default configuration yet it has some sort of memory leak which was causing my system to consume more memory until it became unresponsive and had to he restarted.

You can see below from the tests I did; I was suspecting of both the SpeedTest and Waze integrations, but in the end Waze was OK, and SpeedTest was the culprit.

2 Likes

Perfect finding, can you create a bug issue and share your findings there? I am sure it will take deep dive investigation but it is good to have a starting point

Yup, I will file a bug in a few days, will link it here when I do;

I just want to experiment with a bare docker system first to see if I can reproduce the problem in a simpler / more controlled setup, “hello world style”. Then I’ll file the bug with detailed instructions for reproducing it.

I also want to play a bit with the SpeedTest integration source code to see if I can spot any easily identifiable problem, but that may take a bit longer as my python chops are a bit rusty :slight_smile:

2 Likes

I’m not 100% sure, but on my system the DWD Weather Warnings integration could be the culprit. The steps in memory usage often match the update timestamps of the DWD integration.
But since updating to 2021.12.x i haven’t had a crash. However, due to better weather since the beginning of December, not as many warnings were issued as at the end of November.
I’m one of the maintainers of the DWD integration and after a first look at the code i didn’t find anything that could explain this behaviour, there have been no major changes since six months.
I’ll keep an eye on that and report back if i gain more info.

Since 2021.12.3 my systems (I have 2 in a master slave setup) are now rock solid, no more memory creep. Very happy as this was driving me nuts.

Note: I went from 2021.11.5 straight to 2021.12.3 hence cannot tell which minor changed the behaviour.