Sorry, I just removed the IP from the raspberrypi and it is not happening anymore.
Do you think the memory issue can still be debugged? Or it is something normal?
If it’s not happening anymore there isn’t much to be done since we would need a recording when the issue is occurring
Yep, that is what I was thinking. However, it was not probably a problem with Hassio per se, because it was affecting the entire network. Even the router become unresponsive at certain point.
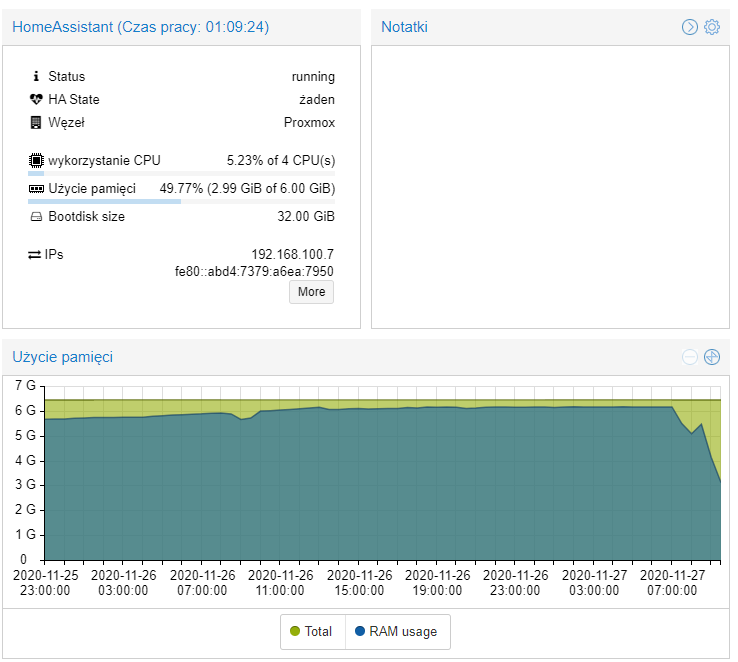
But what about the memory? People report that 2gb is enough to run home assistant, and I assigned 4 to the VM and it is (according to the Hypervisor, proxmox) using 3.5 Gb
2GiB is usually more than enough unless you have thousands of entities. It could be a case of https://www.linuxatemyram.com/
Yep, probably it is that, because I don’t have enough elements to overwhelm a rpi instance I don’t think it will eat the ram of a 4gb VM.
Thanks
Hello,
I came across this topic because I also have a memory issue, see Help: My HA is restaring, why?.
As far as I can see, the host is killing HA because it consumes too much memory (at the end, it reaches 90%).
How can I know what is causing the issue ?
Did you take a look at the link in bdraco’s post above? I’m pretty certain that explains what you are seeing.
Actually yes, I know high memory usage is not an issue by itself. But my memory usage keeps growing over time and at some point, linux is killing HA:
[91096.975793] Out of memory: Kill process 6177 (python3) score 475 or sacrifice child
[91096.985885] Killed process 6177 (python3) total-vm:3798692kB, anon-rss:481348kB, file-rss:0kB, shmem-rss:0kB
My question is maybe not as precise as It should: How can I know what integration/component/other is causing the issue ?
Two potential options are to write some code to use objgraph to dump every object in memory every 30 seconds and see where the growth is, or remove integrations one by one until the issue goes away.
well, yeah, was afraid it would be the response  I have like 30 integrations (and of course some integration, like mqtt, are part of the core of my automation) and I need at least 12 hours to figure out if there is a memory leak.
Anyway, thanks for the response, I’m gonna start with the less important one !
Reducing add-ons helped me.
Hi Brian
Did you notice a difference in behaviour after shifting to a supervised VM?
I’ve been struggling with high memory usage for some months now. I’m running supervised HA on RPi3b+ running Raspbian. I really can’t track down the root cause for increased memory usage but it started this summer. Everything worked fine for months before that…
I’ve tried numerous of things to resolve this issue but nothing seemed to help until this. I increased cache size to twice the size of the RAM available on RPi3b+. After this RAM and cache usage has been steady. I haven’t seen the constant increase in cache and RAM usage that used to be the case before increasing the cache size. I know this might be killing my SDcard but it’s better than daily forced reboots. Maybe I need to migrate my setup to SSD boot.
1 Like
I would recommend SSD boot setup, it’s pretty easy to do nowadays and the speed difference is noticeable.
Hi, I have noticed the memory consumption related to nodeRed. The more automation, especially the subprocesses in subproces, the faster the RAM clogs up.
Try to restart Node Red, if you memory the consumption will be close to 100%
For me, the memory consumption - 6Gb takes about 5 days
1 Like
Is it possible to do an automatic restart in proxmox for an hour, e.g. 02:00?
I’ve created a container and installed Node-Red directly on that. Moved all flows off HA add-in that do not interact with HA directly on to the LXC.
I’ve done the same for Mosquitto (MQTT) and it runs in its own LXC.
The separate LXCs make a much better job of memory management IME.
is there an instruction on how to install it on proxmox?
ok, it worked, here’s a link describing how to do it
1 Like
I’m finding memory usage creeps up quickly if I have a browser open on the Lovelace Dashboard. If I keep them closed memory doesn’t jump as quickly.