Can you help me chart an energy HA statistic in Grafana?
My set up is HA → InfluxDB → Grafana
I have working time series charts in Grafana for temperature, humidity and power sensors.
However, some items I want to chart are only available as HA statistics. They are external statistics exported by Octopus Energy HACS integration previous consumption and export sensors, which are broken down into hourly chunks. When I try to chart them in Grafana it says ‘No data’.
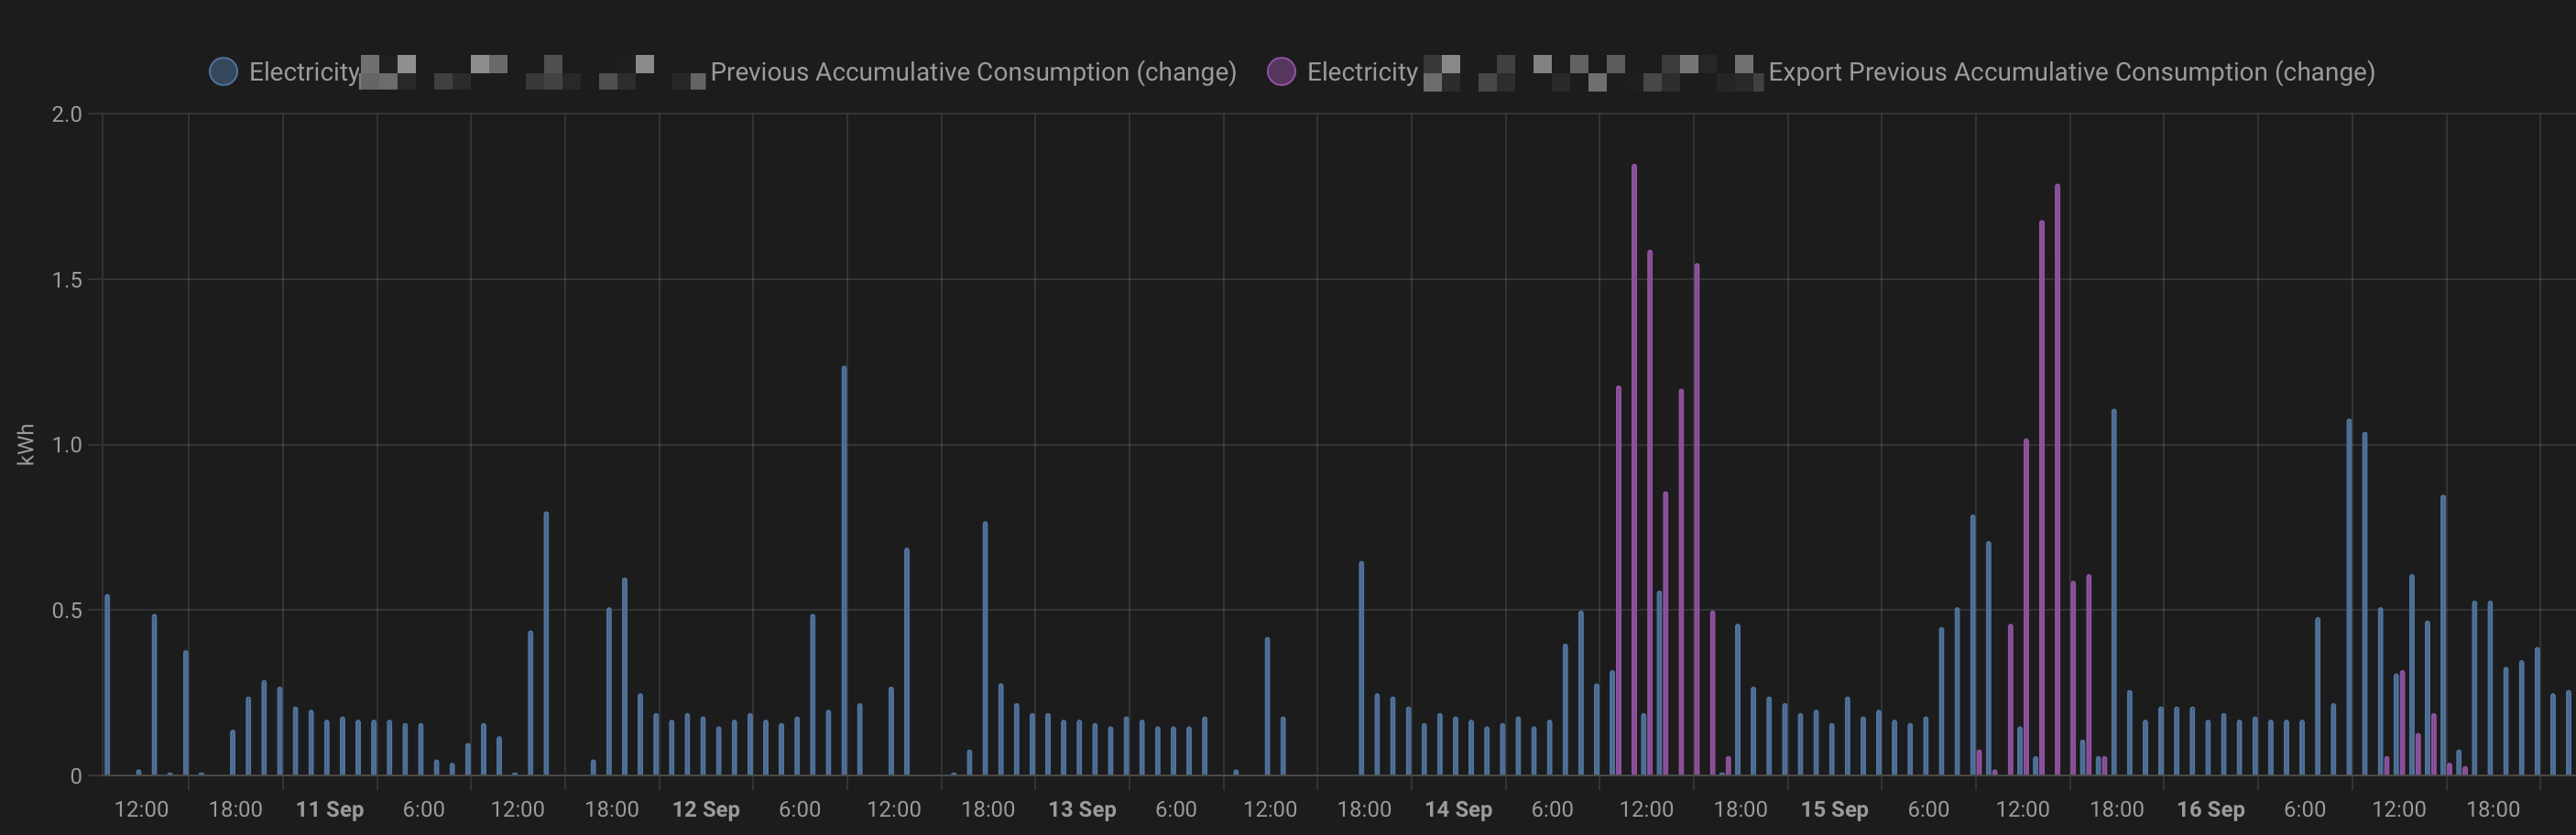
I can successfully chart the HA statistics in the following HA statistics graph:
Here is my attempted Grafana query which results in ‘No data’:
SELECT difference(\"value\")
FROM \"autogen\".\"W\"
WHERE (\"entity_id\"::tag = 'octopus_energy:electricity_xxx_xxx_export_previous_accumulative_consumption')
AND time >= now() - 7d and time <= now()
GROUP BY time(1h) fill(none);
SELECT difference(\"value\")
FROM \"autogen\".\"W\"
WHERE (\"entity_id\"::tag = 'octopus_energy:electricity_xxx_xxx_previous_accumulative_consumption')
AND time >= now() - 7d and time <= now()
GROUP BY time(1h) fill(null)
Long Term Statistics are not exported to InfluxDB, only states are.
If you want data that is only available from long term statistics you will have to create your own template sensors. Who’s states will be imported into InfluxDB.
These aren’t statistics I’ve created myself from a sensor. They are statistics exported by the Octopus Energy HACS integration. So, I don’t think there are any associated energy sensor entities. The closest sensor entities are previous day consumption and export. But, those sensor entities give the whole day’s import/export as a lump and are time-stamped the day after. So, the Octopus Energy HACS dev did a work-around to produce these statistics which are broken down into hourly chunks and have the correct time-stamp. Is it not possible to use statistics in a template sensor?
The documentation for that third party integration indicates that there are two energy consumed sensors:
For consumed energy you want sensor.octopus_energy_electricity_{{METER_SERIAL_NUMBER}}_{{MPAN_NUMBER}}_current_consumption or sensor.octopus_energy_electricity_{{METER_SERIAL_NUMBER}}_{{MPAN_NUMBER}}_current_accumulative_consumption
Unfortunately, those sensor entities are only available for Octopus Energy customers who have a working Octopus Mini (hardware device that gets nearly-live data from the electricity meter). Not me.
I really appreciate you taking the time to help me with this.
I have found a likely entity attribute for the export.
The entity is: sensor.octopus_energy_electricity_xxx_xxx_export_previous_accumulative_consumption
The attribute is: Charges.consumption which has 48 entries (30 minute lumps instead of 1 hour lumps) with corresponding ‘from’ and ‘to’ times.