
Full guide here: https://smarthomepursuits.com/how-to-track-stock-in-home-assistant/
In this guide, I’m going to show you how to quickly and easily track your favorite stocks from within Home Assistant. Whether you are wanting to track GME, AMC, BB, or any of the other meme stocks that are exploding in popularity lately, this is a great way to do right from within Home Assistant. If you are more of a cryptocurrency fan, I have a How To Track Crypto in Home Assistant guide you can follow.
By the end of this guide, you will be able to track any stock you want, create a beautiful Lovelace card for each one, and then create an automation once a stock hits a certain $ threshold.
This guide assumes you already have HACS installed.
Step 1: Install Avanza_Stock from the HACS Store
Click HACS on your sidebar. Then search for Avanza Stock.

Then, restart Home Assistant from Configuration > Server Controls > restart Home Assistant.
Step 2: Find Stocks
Next, you need to find the stock market stocks that you want to track. In my case, I want to track Gamestop and AMC (GME, AMC).
Go to this URL and search for them: https://www.avanza.se/ This is a Swedish site, but if using Google Chrome or Edge it’ll prompt you to translate, which I recommend you do.
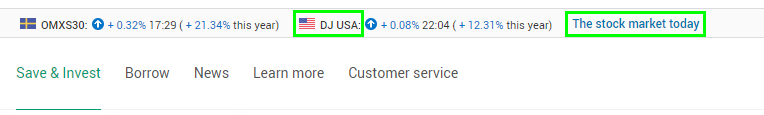
Click one of the stocks on the ticker at the top or click “The Stock Market Today”. This will bring you to a page where you can search for stocks.
Then click Search in the top right corner. Search for a stock and then click it.

Located in the URL you will the stock ID number. Grab as many stock ID’s during this step as you want to track and paste them into Notepad or something similar temporarily.
![]()
- Gamestop = 194698
- AMC = 450548
Step 3: Create Sensors in Configuration.yaml
Next, click File Editor in Home Assistant > configuration.yaml. If you only want to track one stock with all defaults, create a sensor like this:
sensor:
  - platform: avanza_stock
    stock:
      - id: 194698
        name: Gamestop
Since we are going to track two stocks, my sensor looks like this:
sensor:
  - platform: avanza_stock
    stock:
      - id: 194698
        name: Gamestop
      - id: 450548
        name: AMC
Note: If you already have a sensor: defined in configuration.yaml, just add everything starting at - platform:For example, I already had several sensors created for my Upcoming Sports Card so I just added this at the very top of my existing sensor:

Step 4: Create a Basic Entities Card to Show Stock Prices
As a quick test, you can add a basic “entities” card to Lovelace by adding sensor.gamestop and sensor.amc. Here’s what that will look like:

Optional: Create Custom Card with Graph
Like I said at the beginning of the guide, you will need HACS installed for this part. Install the Mini-Graph-Card frontend integration.

Add each of these as separate Lovelace cards (Add Card > Manual). Note that if you only see a flat line, that doesn’t mean the graph isn’t working. That just means you are probably tracking prices after the markets have closed at 4pm ET, therefore the stock price hasn’t changed. Wait until the market opens again at 9:30am ET and view it again.
Gamestop Card
entities:
  - sensor.gamestop
graph: line
hour24: false
hours_to_show: 24
name: Gamestop Price - Last 24hrs
show:
  extrema: true
  icon: true
  name: true
type: custom:mini-graph-card
AMC Card (bar graph)
type: custom:mini-graph-card
name: AMC Price - Last 24hrs
icon: hass:currency-usd
entities:
  - sensor.amc
hour24: false
hours_to_show: 24
show:
  extrema: true
  icon: true
  graph: bar
  name: true
  name_adaptive_color: true
  icon_adaptive_color: true
For even more card customization, you can add any of these under the show: section:
-
graph: false(doesn’t show graph) -
name_adaptive_color: true(changes name to match bar graph color) -
icon_adaptive_color: true(changes icon to match bar graph color) - A full list of options can be found here
Wrapping Up
Hopefully you found this stock tracker within Home Assistant guide useful!
The next thing I need to figure out is how to create an alert once a stock price hits a certain threshold. Once I get that figured out, I’ll be sure to update this guide.


