Lovelace: mini graph card

Good evening,
I have a problem with an implementation,
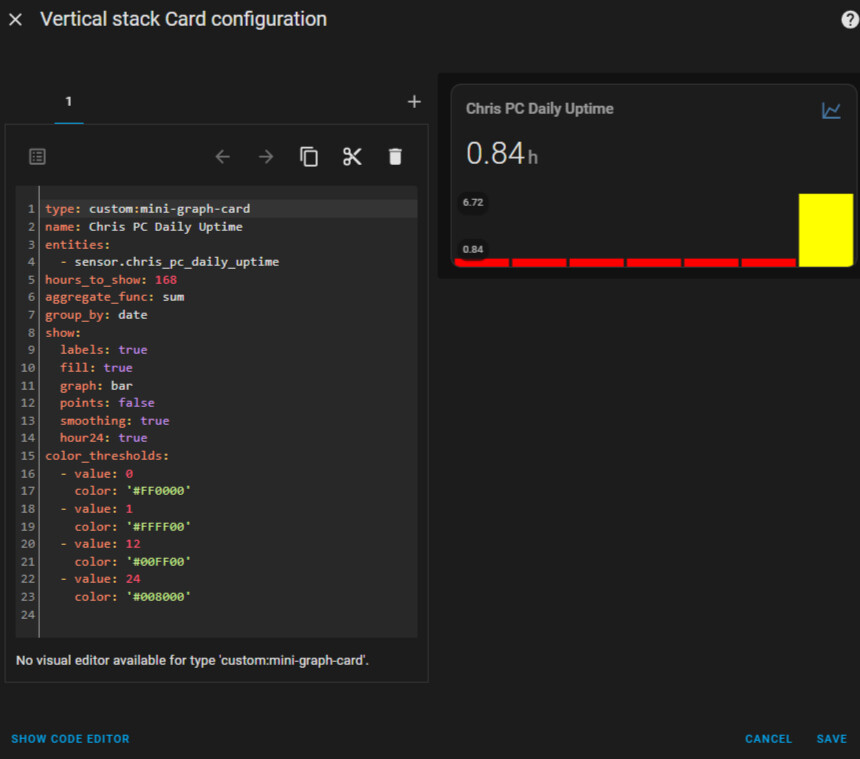
I want to record the uptime in hours and minutes of a computer per day.
I use a binary_sensor.chris_pc with Ping (ICMP) integration,
On this, I record when the computer is connected,
I have done this:

    name: Chris PC Daily Uptime
    entity_id: binary_sensor.chris_pc
    state: 'on'
    type: time
    start: '{{ now().replace(hour=0, minute=0, second=0) }}'
    end: '{{ now() }}'

to measure the hours, and then I placed it on the card like this:

But I see that it records it wrong. What I want, I think, is simple,
I want to measure the usage per day to know how many hours the computer was on per day, can it be done?

Hi, Is there any way to get a action to happen when i click on the actual graph ?
It works clicking on any of the text or icon. but would like it to also work on the graph as I like the clean no points no label look.
want to go to more-info when i click the graph.

How to add different icons to displayed states of entities (marked as red 1 and 2)?
image

My graph is generally connected to first entity and Iā€™d like to add only numeric value of second one and mark both by icons showing what is there. I tried to look for solution by own, but this thread is too big, sorry.

Hi folks, I think thereā€™s either a minor bug with this card, or Iā€™m merely entering my yaml incorrectly!

The following code is only bringing up the more-info window for the sensor (which is shown on the graph) rather than the light entity Iā€™d like it to be:

type: custom:mini-graph-card
entities:
  - entity: sensor.living_room_temperature
    name: Temperature
    show_state: true
    show_points: true
tap_action:
  action: more-info
  entity: light.ceiling_living_room

Just following up on thisā€¦ It transpires that clicking the ā€œTitleā€ at the top of the card opens the tap_action target entity, however, clicking the state thatā€™s displayed opens the original entity. I canā€™t seem to establish a way to make the state target the other entity too?

Is it possible to display a graph with e.g. the sum of two entities without a helper?

Not possible.

I guess only some zones are for this defined ā€œtap_actionā€:

  • red - to show more-info for entities;
  • green - no action;
  • other - for the defined ā€œtap_actionā€.

Exactly! It feels as if there should be an option to be able to allow the defined tap_action to also point to a custom area when clicked in your ā€œgreen zoneā€ - even better would be if could click on a specific entity from the ā€œentitiesā€ list in your green zone and it direct to a custom tap_action - similar to ApexCharts

Not good since points on a graph are supposed to be selected by a mouse to show a state.

Iā€™m trying to add treading arrows that change depending on weither the trend is decreasing or increaseing in place of the icon using the icon_image: option

Iā€™ve already made the automations and the sensors that handle tracking the trend. They work fine.
What I have so far but it results in a broken image.
but icon_image: /local/green_arrow.png works perfectly.
With the added if statements it results in a broken image which when right-clicked on and copy image addressed this is what it gives me http://192.168.1.2:8123/lovelace/%7B%%20if%20is_state('sensor.temperature_trend',%20'increasing')%20%%7D%20%20/local/red_arrow.png%7B%%20elif%20is_state('sensor.temperature_trend',%20'decreasing')%20%%7D%20%20/local/gray_arrow.png%7B%%20else%20%%7D%20%20/local/green_arrow.png%7B%%20endif%20%%7D

Here is my code

  - type: custom:mini-graph-card
    entities:
      - sensor.temperature
    icon_image: |
      {% if is_state('sensor.temperature_trend', 'increasing') %}
        /local/green_arrow.png
      {% elif is_state('sensor.temperature_trend', 'decreasing') %}
        /local/red_arrow.png
      {% else %}
        /local/gray_arrow.png
      {% endif %}
    show:
      labels: false
      labels_secondary: false
    refresh_interval: 0
    color_thresholds:
      - value: 85
        color: '#ff0000'
      - value: 80
        color: '#ffa500'
      - value: 75
        color: '#39FF14'
      - value: 65
        color: '#00ffff'
        line_width: 10
        font_size: 75

Templates not supported.

There is no such an option.

wrong indents

Templates not supported. Understood

but can icon color be changed with something like:

style: |
ha-icon {
color: [[ if(sensor.temperature_trend = stable, ā€œgray;ā€, if(sensor.temperature_trend = increasing, ā€œgreenā€, if(sensor.temperature_trend = decreasing, ā€œredā€))) ]]
}

google about card-mod

1 Like

even though not orginally perceived as helpful, you actually did help. thanks sorta.

solution:

card_mod:
style: |
ha-icon {
color: {% if states(ā€˜sensor.temperature_trendā€™) == ā€˜stableā€™ %}
gray;
{% elif states(ā€˜sensor.temperature_trendā€™) == ā€˜increasingā€™ %}
green;
{% elif states(ā€˜sensor.temperature_trendā€™) == ā€˜decreasingā€™ %}
red;
{% endif %}
}

icon changes and color:

card_mod:
style: |
ha-icon {
{% if states(ā€˜sensor.temperature_trendā€™) == ā€˜decreasingā€™ %}
color: red;
ā€“icon-symbol: mdi:arrow-down-bold-outline;
{% elif states(ā€˜sensor.temperature_trendā€™) == ā€˜stableā€™ %}
color: gray;
ā€“icon-symbol: mdi:minus;
{% elif states(ā€˜sensor.temperature_trendā€™) == ā€˜increasingā€™ %}
color: green;
ā€“icon-symbol: mdi:arrow-up-bold-outline;
{% endif %}
}

I apologize I didnt intend on upsetting you. I did mean it when I said thanksā€¦

image

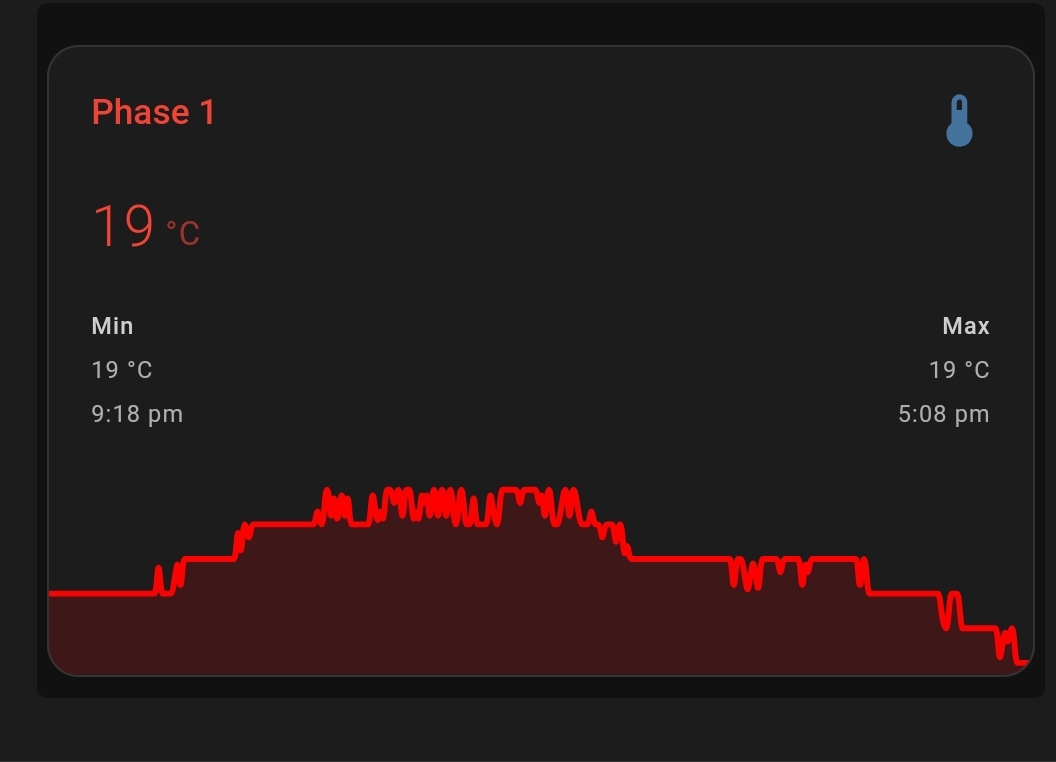
Hi, experimenting with this amazing card.
I made this card to monitor voltage on all 3 phases. But I canā€™t get the color of the voltage to match the color of the line graph. Any help is appreciated. Code is below.

type: custom:mini-graph-card
name: Phase 1
show_state: true
state_adaptive_color: true
entities:
  - sensor.infini_3kw_lhr_voltage
line_width: 3
font_size: 80
hours_to_show: 6
points_per_hour: 60
decimals: 0
hour12: true
color_thresholds:
  - value: 250
    color: red
  - value: 255
    color: white
show:
  extrema: true
  name_adaptive_color: true
  state_adaptive_color: true

like this ?

will need card_mod

type: custom:mini-graph-card
card_mod:
  style: |
    .states.flex {
      color: var(--red-color);
    }
name: Phase 1
show_state: true
state_adaptive_color: true
entities:
  - sensor.kitchen_temperature
line_width: 3
font_size: 80
hours_to_show: 6
points_per_hour: 60
decimals: 0
hour12: true
color_thresholds:
  - value: 250
    color: var(--red-color)
  - value: 255
    color: white
show:
  extrema: true
  name_adaptive_color: true
  state_adaptive_color: true

Yes that is exactly what I want, but somehow, itā€™s still not working for me, even after adding the card mod.

image

This is not supposed to be done by card-mod.
Use a native ā€œstate_adaptive_color: trueā€ - what you tried to do but placed the option into a wrong place, itā€™s an ā€œentityā€ object.
In fact, many options in your code are misplaced - check Docs.