Thank you for the idea ! I managed to add the arrows as a webfont, with using a nice fat SVG arrow that I have rotated or doubled, just after the unit of mesure.
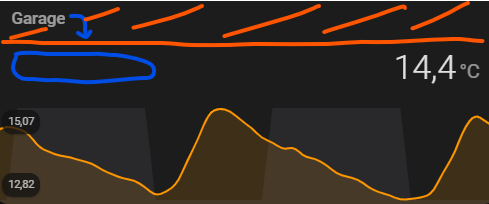
Here is the result with the 3 types of arrows. :

I’m very pleased by the result !
Thank you for the idea ! I managed to add the arrows as a webfont, with using a nice fat SVG arrow that I have rotated or doubled, just after the unit of mesure.
Here is the result with the 3 types of arrows. :
I’m very pleased by the result !
I would simply use
{% if is_state(xxx,'off') -%}
  0
{%- else -%}
  1
{%- endif %}
and in some cases (dependently on a nature of a binary_sensor) it is needed to have a “reverted” logic:
{% if is_state(xxx,'on') -%}
  0
{%- else -%}
  1
{%- endif %}
Very nice, please share the final code with an svg thing for posterity))
Here is the final code associated to the screenshots :
type: custom:mini-graph-card
entities:
  - sensor.c_guhring_free_fr_glucose_value
hours_to_show: 12
name: Glycémie Christophe
icon: mdi:wifi
align_state: center
points_per_hour: 12
hour24: true
decimals: 0
lower_bound: 40
height: 200
font_size: 150
color_thresholds:
  - value: 0
    color: "#ff0000"
  - value: 60
    color: "#ff0000"
  - value: 100
    color: "#0077ff"
  - value: 110
    color: "#00ff00"
  - value: 160
    color: "#00ff00"
  - value: 190
    color: "#ff9000"
card_mod:
  style: |
    {% set VALUE = states('sensor.c_guhring_free_fr_glucose_value') %}
    {% set TREND = states('sensor.c_guhring_free_fr_glucose_trend') %}

    ha-card .state__value {
      font-weight: 800;
      font-size: 350%;
      margin-right: 10px;
      font-family: "Open Sans";

      {% if (VALUE | int >= 180) %}
        color: #ff9000;
      {% elif (VALUE | int >= 100) %}
        color: #00ff77;
      {% elif (VALUE | int >= 70) %}
        color: #00aaff;
      {% elif (VALUE | int <= 69) %}
        color: #ff5050;
      {% endif %}
    }

    ha-card .state__uom {
      font-weight: normal;
      font-size: 100%;
      position: relative;
      top: -18px;
      opacity: 1;
      color: #999999;
    }

    ha-card .state__uom:after {
      font-family: "arrows" !important;
      color: #ffffff;
      {% if (TREND == 'rising_quickly') %}
        content: "⇈";
        color: #ff9090;
      {% elif (TREND == 'rising') %}
        content: "↑";
        color: #ff9000;
      {% elif (TREND == 'rising_slightly') %}
        content: "↗";
      {% elif (TREND == 'steady') %}
        content: "→";
      {% elif (TREND == 'falling_slightly') %}
        content: "↘";
      {% elif (TREND == 'falling') %}
        content: "↓";
      {% elif (TREND == 'falling_quickly') %}
        content: "⇊";
        color: #ff9090;
      {% endif %}

      font-weight: normal;
      font-size: 300%;
      line-height: 1.2em;
      position: relative;
      top: 15px;
    }

    ha-card .header.flex, ha-card .states.flex {
      padding-bottom: 0;
    }
Here is the font with the js module to add to lovelace ressouces for making available “arrows” font. lovelace_arrows_font.zip (I have tryed several methods, it is the only one that is working…) I also added as a ressource, open sans @ wheight 800 from google fonts for the thick numbers.
Hi,
I’m using the mini graph card to track the temperature in my living room.
Normally, the temperature should fluctuate between 19.5 and 20.5 degrees (celcius).
Could I add some horizontal lines at these fixes values, so I can see if and when the temperature drops below (or goes above) this temperature?
Thx,
Dries
Create two template sensors with fixed values and add them to the graph.
In mini-graph-card you need to change getFill(path) method in graph.js file.
The trick is in the calculation of height of the filling shape.
Current line
const height = this.height + this.margin[Y] * 4;
should be replaced by
const height = this._calcY([[0,0,0]])[0][1]
Instead of filling full height of the graph (this.height) it takes only calculated 0 relative position on that graph.
_calcY method takes coordinates as array [X,Y,V] - X axis, Y axis, Value. From Value, it calculates relative position on Y axis. And this is it. You can then define whatever border value to fill the graph.
So generally you have to change: this._calcY([[0,0,‘Border Value’]])[0][1]
[0][1] = [0] - takes first element of the array (we have only one array)
[1] - takes second (middle) element from array [X,Y,V] = Y
I have not forgotten about this post, was too busy, will try to check it soon.
Is it possible to label a point on this card?
I am hoping to have a value floating to the right of the last point on the line showing the current value.
hi, if i set extreme to true i can see min and max value. is there a way to hide the min value and show only max?
Google card-mod in this thread.
Or go to the main card-mod thread - 1st post - link at the bottom - mini-graph-card
@Ildar_Gabdullin there has to be a way to pin excellent posts like this one.
All card-mod related posts are pinned:
main card-mod thread → 1st post → link at the bottom titled “fantastic” → mini-graph-card
Of course there are other possibly useful posts not related to card-mod. They are not pinned… Not to mention useful posts of other users.
P.S. Still have not analysed your post about “aggregate_func”, returned home just yesterday, will try to do it soon.
“aggregate_func = max” is giving me the perfect result. No half height spikes in the graph.
I am pleased I got the 1st post link. I just need to remember to go to the 1st post in the card mod thread prior to scrolling 1588 posts.
Maybe a card-mod cookbook similar to the home assistant cookbook could be on the cards one day, excuse the pun.
A few good indexes would help pull all of the good information together.
I tried to find the information over this long list of replies but I didn’t succeed.
Seems basic request of card mod but I can’t find a way to do it.
I would like to have the ability to put the text at same level as the value like shown on the screenshot below
Hi there, Been wondering how to get a fill like Statistics Graph Card offers.
What I have is a 3 data graph, on top the max, then the actual value and at the bottom the min line, and what I like to get is the fill only between the max and the min lines.
that´s the actual code, where I am testing…
type: custom:mini-graph-card
entities:
  - entity: climate.termostato_salon
    attribute: current_temperature
    aggregate_func: max
    color: "#9A9EEC"
    show_fill: false

  - entity: climate.termostato_salon
    attribute: current_temperature
    color: "#409D44"
    show_fill: false


  - entity: climate.termostato_salon
    attribute: current_temperature
    aggregate_func: min
    color: "#9A9EEC"
    show_fill: false


group_by: hour
height: 200
hours_to_show: 24
animate: true
smoothing: true
lower_bound: ~15
upper_bound: ~29
show_indicator: true
fill: false
extrema: true
line_width: 2
icon: mdi:thermometer
Long path to achieve smth similar:
Main card mod thread - 1st post - “fantastic” link at the bottom - mini-graph-card - how to mimic statistics-card
thx, I´ll take a look.
sorry, I can´t get to it, searching for how to mimic statistics-card shows no result but this post of yours., clould you please provide link?
I cannot, keep searching (it is not hundreds of links there), may be not exactly “mimic”