Lovelace: mini graph card

@Ildar_Gabdullin, yes…

Is it possible to graph line and bars on the same graph?

According to this:


not possible to have both line & bar graphs ((

Actually I prefer not to use a bar graph.
As I understood, a value for each DISPLAYED point is calculated dependingly on:

  • hours_to_show;
  • points_per_hour;
  • aggregate_func;
  • sensor’s value.
    It is an interpolation.
    For the bar graph there are less displayed points than for the line graph.
    That means that the bar graph may not reflect a real curve.

My proposal - use a line power consumption graph + line average graph.

1 Like

can anyone help me explain this in simple english / dutch. I also have solar panels, and would like to see my weekly consumption in + & -. so green if my net consumption is lower than 0, and red if it is above 0.

Styling the card with “card-mod”:

Changing background color:
Note: this style may be used to make a card transparent.
image

type: 'custom:mini-graph-card'
entities:
  - sensor.cleargrass_1_temp
show:
  labels: true
card_mod:
  style: |
    ha-card {
      --ha-card-background: rgba(50,50,50,0.2);
    }

Background image:
image

type: 'custom:mini-graph-card'
entities:
  - sensor.cleargrass_1_temp
show:
  labels: true
card_mod:
  style: |
    ha-card {
      background-image: url("/local/images/blue_low_2.jpg");
      background-size: 100% 100%;
    }

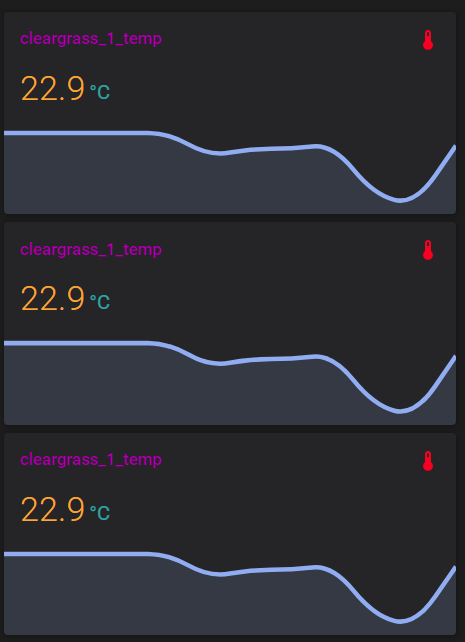
All text is colored:
изображение

type: 'custom:mini-graph-card'
entities:
  - sensor.cleargrass_1_temp
show:
  labels: true
  average: true
  extrema: true
card_mod:
  style: |
    ha-card {
      color: red;
    }

Colored title & icon:
изображение

type: 'custom:mini-graph-card'
entities:
  - sensor.cleargrass_1_temp
show:
  labels: true
  average: true
  extrema: true
card_mod:
  style: |
    .header.flex .name.flex {
      color: green;
    }
    .header.flex .icon {
      color: red;
    }

Resized icon:
изображение

type: 'custom:mini-graph-card'
entities:
  - sensor.cleargrass_1_co2
show:
  labels: true
  average: true
  extrema: true
card_mod:
  style: |
    .header.flex .icon {
      --mdc-icon-size: 60px;
    }

Colored state & min/max/avg info:
изображение

type: 'custom:mini-graph-card'
entities:
  - sensor.cleargrass_1_temp
show:
  labels: true
  average: true
  extrema: true
card_mod:
  style: |
    .states.flex {
      color: orange;
    }
    .info.flex {
      color: red;
    }

Colored state value, colored unit:
изображение

type: 'custom:mini-graph-card'
entities:
  - sensor.cleargrass_1_temp
show:
  labels: true
  average: true
  extrema: true
card_mod:
  style: |
    .states.flex .state .state__value.ellipsis{
      color: orange;
    }
    .states.flex .state .state__uom.ellipsis{
      color: cyan;
    }

Colored info: different colors:
изображение

type: 'custom:mini-graph-card'
entities:
  - sensor.cleargrass_1_temp
show:
  labels: true
  average: true
  extrema: true
card_mod:
  style: |
    .info.flex .info__item .info__item__type {
      color: red;
    }
    .info.flex .info__item .info__item__value {
      color: green;
    }
    .info.flex .info__item .info__item__time {
      color: cyan;
    }

Colored info: only max:
изображение

type: 'custom:mini-graph-card'
entities:
  - sensor.cleargrass_1_temp
show:
  labels: true
  average: true
  extrema: true
card_mod:
  style: |
    .info.flex div.info__item:nth-child(3) {
      color: red;
    }

Colored info: only max, different colors:
изображение

type: 'custom:mini-graph-card'
entities:
  - sensor.cleargrass_1_temp
show:
  labels: true
  average: true
  extrema: true
card_mod:
  style: |
    .info.flex div.info__item:nth-child(3) .info__item__type {
      color: red;
    }
    .info.flex div.info__item:nth-child(3) .info__item__value {
      color: green;
    }
    .info.flex div.info__item:nth-child(3) .info__item__time {
      color: cyan;
    }

Colored labels:
изображение

type: 'custom:mini-graph-card'
entities:
  - sensor.cleargrass_1_temp
show:
  labels: true
  average: true
  extrema: true
card_mod:
  style: |
    .graph .graph__container .graph__labels {
      color: red;
    }

Colored labels (different colors):
изображение

type: 'custom:mini-graph-card'
entities:
  - sensor.cleargrass_1_temp
show:
  labels: true
  average: true
  extrema: true
card_mod:
  style: |
    .graph .graph__container .graph__labels .label--max {
      color: green;
    }
    .graph .graph__container .graph__labels .label--min {
      color: red;
    }

How to style if secondary Y-axis is present:
Let’s add one more graph and set a style to labels:
изображение

type: 'custom:mini-graph-card'
entities:
  - entity: sensor.cleargrass_1_temp
    name: Temp
    show_state: true
  - entity: sensor.cleargrass_2_co2
    name: CO2
    show_state: true
    y_axis: secondary
show:
  labels: true
  name: false
  icon: false
  average: false
  extrema: false
  labels_secondary: true
card_mod:
  style: |
    .graph .graph__container .graph__labels {
      color: red;
    }

Also we can style a color for the legend:
изображение

type: 'custom:mini-graph-card'
entities:
  - entity: sensor.cleargrass_1_temp
    name: Temp
    show_state: true
  - entity: sensor.cleargrass_2_co2
    name: CO2
    show_state: true
    y_axis: secondary
show:
  labels: true
  name: false
  icon: false
  average: false
  extrema: false
  labels_secondary: true
card_mod:
  style: |
    .graph .graph__legend {
      color: red;
    }

Now let’s tune up colors for Y-axis & legend for every graph:
изображение

type: 'custom:mini-graph-card'
entities:
  - entity: sensor.cleargrass_1_temp
    name: Temp
    show_state: true
    color: red
    state_adaptive_color: true
  - entity: sensor.cleargrass_2_co2
    name: CO2
    show_state: true
    color: green
    state_adaptive_color: true
    y_axis: secondary
show:
  labels: true
  name: false
  icon: false
  average: false
  extrema: false
  labels_secondary: true
card_mod:
  style: |
    .graph .graph__container .graph__labels.--primary.flex {
      color: red;
    }
    .graph .graph__container .graph__labels.--secondary.flex {
      color: green;
    }
    .graph .graph__legend div:nth-child(1) {
        color: red;
    }
    .graph .graph__legend div:nth-child(2) {
        color: green;
    }

Changing font-size:
For each element:
изображение

type: 'custom:mini-graph-card'
entities:
  - sensor.cleargrass_1_temp
show:
  labels: true
  average: true
  extrema: true
card_mod:
  style: |
    .header.flex .name.flex {
      font-size: 10px;
    }
    .states.flex .state .state__value.ellipsis {
      font-size: 15px;
      align-self: center;
    }
    .states.flex .state .state__uom.ellipsis {
      font-size: 18px;
      align-self: center;
    }
    .info.flex .info__item .info__item__type {
      font-size: 12px;
    }
    .info.flex .info__item .info__item__value {
      font-size: 18px;
    }
    .info.flex .info__item .info__item__time {
      font-size: 8px;
    }
    .graph .graph__container .graph__labels {
      font-size: 18px;
    }

For legend:
изображение

type: 'custom:mini-graph-card'
entities:
  - entity: sensor.cleargrass_1_temp
    name: Temp
    show_state: true
  - entity: sensor.cleargrass_2_co2
    name: CO2
    show_state: true
    y_axis: secondary
show:
  labels: true
  name: false
  icon: false
  average: false
  extrema: false
  labels_secondary: true
card_mod:
  style: |
    .graph .graph__legend {
      font-size: 8px;
    }

Hiding dates for MAX & MIN data:
изображение

type: 'custom:mini-graph-card'
entities:
  - sensor.cleargrass_1_temp
show:
  labels: true
  extrema: true
card_mod:
  style: |
    .info.flex .info__item .info__item__time {
      display: none;
    }

Hiding MAX or MIN data:
изображение

type: 'custom:mini-graph-card'
entities:
  - sensor.cleargrass_1_temp
show:
  labels: true
  extrema: true
card_mod:
  style: |
    .info.flex div.info__item:nth-child(1) {
      color: transparent;
    }
    .info.flex div.info__item:nth-child(2) {
      color: red;
    }

Another example - how to show “avg” & “max” labels:
275333927-6ec83823-3e4a-45c0-9b01-eacb6f9c9d72

        type: custom:mini-graph-card
        entities:
          - sensor.xiaomi_cg_1_temperature
        show:
          labels: true
          average: true
          extrema: true
        style: |
          .info.flex div.info__item:nth-child(1) {
            display: none;
          }
          .info.flex div.info__item:nth-child(2) {
            text-align: left;
          }

Hiding a unit for special cases:
изображение изображение

type: 'custom:mini-graph-card'
entities:
  - sensor.cleargrass_1_temp
show:
  labels: true
card_mod:
  style: |
    .states.flex .state .state__uom.ellipsis {
      {% if states('sensor.cleargrass_1_temp') in ['unavailable','unknown'] %}
        display: none;
      {% endif %}
    }
state_map:
  - value: unavailable
    label: Sensor off
  - value: unknown
    label: Sensor off

Animation - blinking name, resized & rotating icon:
post
1111
aaa


Display an additional info on the card:
post


Display additional text items (prefixes & suffixes):
post
image

Playing with animated curve:
post

One style for all graphs in a stack:
post


Solid fill:
All credits to @menloperk !
post
изображение
Update 15.08.22: does not seem to work in Safari & iOS Companion App.


Place state values in one line:
post
image


Show a graph for the 2nd sensor on the bottom:
post
изображение


Set a color for the last bar:
post
изображение


Place 2 sensors’ states on the left side:
post
image


Display states as a part of the legend:
post
image


Display a unit under the state:
post
image


Display a state & extrema data on the same line:
post
image
All credits to @reste_narquois !


Fixing an issue with a card inside state-switch:
post


Placing a UoM before a state’s value:
post
image


Imitating statistics card:
post
image


How to nicely align legend’s elements:
post
изображение


Styling labels’ background:
post
изображение


How to change graph’s color dynamically:
post

34 Likes

I’m busy with integration my energy consumption and costs. Is there any way to combine the red and blue bars? Or to hide the blue bar, but only show the value when hovering over one of the red bars?

image

2 Likes

Is there a way to group by something less than 1 hour?

I am tracking energy costs, i have 30 minute updates on the tariff but the graph can only group by 1 hour intervals which makes it slightly incorrect.

Any tips on how to get this graph right

image

The last bar is too low compared to the one to the left. I assume it’s because it’s using that bar as lowest point (hence the 4.41 value on the left’

I made a template to combine current tariff1 and tariff2 value of today.

#Combine Energy peak/offpeak
  - platform: template
    sensors:
      daily_energy_power_total:
        friendly_name: 'Daily Energy Peak/Offpeak Total'
        entity_id:
          - sensor.daily_energy_offpeak
          - sensor.daily_energy_peak
        value_template: "{{ (states('sensor.daily_energy_peak')|float + states('sensor.daily_energy_offpeak')|float)|round(3) }}"
        unit_of_measurement: "kWh"
      monthly_energy_power_total:
        friendly_name: 'Monthly Energy Peak/Offpeak Total'
        entity_id:
          - sensor.monthly_energy_peak
          - sensor.monthly_energy_offpeak
        value_template: "{{ (states('sensor.monthly_energy_peak')|float + states('sensor.monthly_energy_offpeak')|float)|round(3) }}"
        unit_of_measurement: "kWh"

type: 'custom:mini-graph-card'
entities:
  - entity: sensor.daily_energy_power_total
name: Energy consumption (Weekly)
hours_to_show: 168
aggregate_func: max
group_by: date
show:
  graph: bar

How often is your sensor updated?

My sensor.daily_energy_power_total updates every few seconds whenever there is a change.

The day has passed and now yesterdays bar has increased a lot now. Am I correct to say that the current day(bar) doesn’t grow over the day but gets populated when the day has passed?

As far as I understood, the "group_by" feature works like this (@kalkih please correct me):

  1. There is an array of values of some sensor (updated every XXX seconds/minutes).
  2. A usual LINE graph shows a curve reflecting every value (+ some interpolation dependingly on "scan_interval" & "points_per_hour" & "hours_to_show").
  3. Grouping per hour: for every hour an “Arithmetic mean” is calculated (sum of values within this hour / number of values). This calculated value then is displayed in the graph as a value for this particular hour.

To investigate any strange behaviour with "group_by" I recommend you not to use grouping first; then if everything looks fine - use "group_by".

1 Like

I am working on electrical energy monitoring with a combination of the Riemann sun integration, the utility meter integration and the mini graph custom cards. I get my energy readings through Smappee energy monitor.

All works pretty smooth within the range of a week. In the bar charts data per hour is fine and grouped per hour or date works perfectly. However once you go beyond that range problems start.

Could the hours_to_show changed to time_to_show with a selection of hours, day, week, month, year (like the utility meter also counts the data).

And the same for grouped_by not only hour or date but calendar_week, calendar_month or calendar_year?

There is the option for interval but I couldn’t find any description on how to use that.

I read quite some threads facing similar issues. I think it would create great flexibility.

Finally I like to say I like the cards a lot. I don’t understand why this is not replacing the standard history graph in Lovelace!

For deep serious analysis some people prefer to use a software like Grafana with it’s rich tools.

I have tried that too but I found it too complicated and I couldnt get it going unfortunately.

Note that by default the database is purged every 24 days. Probably the default DB engine is not good for longer periods

24 days in itself is enough. I would aggregate the data like its done in the utility meter.

Since we are talking… Do you know how the grouped_by: interval works. I can’t find any example.

1 Like

My mistake. By default DB is purged every night and keeps data for 10 days.

Would you mind sharing your configuration for this? I like the look.

I believe I’ve just recreated it:

climate_graph

sensors.yaml

- platform: template
  sensors:
    # To recreate default HA climate card
    heating_from_temp:
      friendly_name: Heating status
      device_class: temperature
      value_template: >-
        {% if states('sensor.toon_room_temp')|float < states('sensor.toon_room_temp_setpoint')|float %}
          {{ states('sensor.toon_room_temp') }}
        {% else %}
          0
        {% endif %}

Lovelace:

entities:
  - sensor.toon_room_temp
  - entity: sensor.heating_from_temp
    color: green
    show_line: false
    show_points: false
    show_legend: false
    smoothing: false
  - entity: sensor.toon_room_temp_setpoint
    color: '#039BE5'
    show_legend: false
    show_state: true
    smoothing: false
    show_fill: false
font_size: 75
name: Keuken
lower_bound: 17
hours_to_show: 4
line_width: 3
points_per_hour: 60
type: 'custom:mini-graph-card'
show:
  extrema: true
  average: true
  state: true
color_thresholds:
  - color: '#039BE5'
    value: 15
  - color: '#0da035'
    value: 17
  - color: '#e0b400'
    value: 19
  - color: '#e45e65'
    value: 21

edit: make float in temperature comparison, otherwise it compares the length of the string.

6 Likes