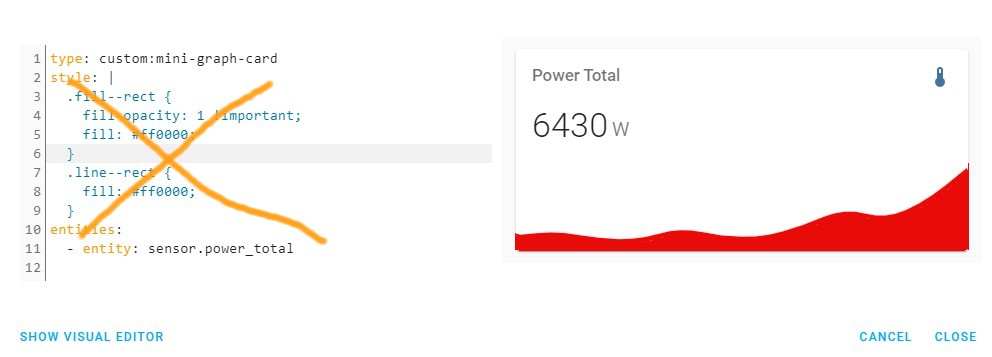
In other words, or illustrated by a more simple example…
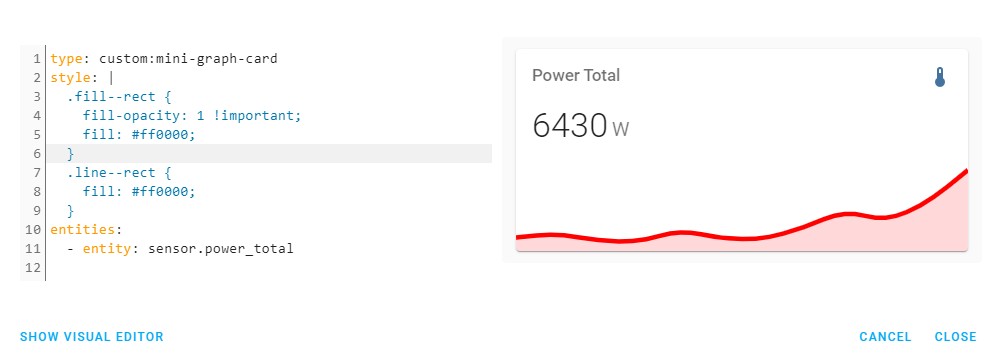
What I am trying to achieve is having the fill underneath the line just as red as the line itself (this is an edited screenshot):
I was thinking it was more faint because it is opaque to some degree but it seems there is more going on here…
2 Likes
JasonLee
November 6, 2021, 11:35am
1915
How do I change the proportions on the mini graph card? By default, the graph appears to be 50% the height of the card and the labels 50%.
How would I adjust it, so for example the graph took up 75% of the height of the card and the labels only 25%?
And adding x and y-axis numbering is still not possible right?
JasonLee:
How would I adjust it
Could you provide a picture describing your needs?
Just for completeness, I finally managed to get it done through trial-and-error. Solution turns out to be fairly easy…
style: |
  .fill {
    fill: white;
    opacity: 1 !important;
  }
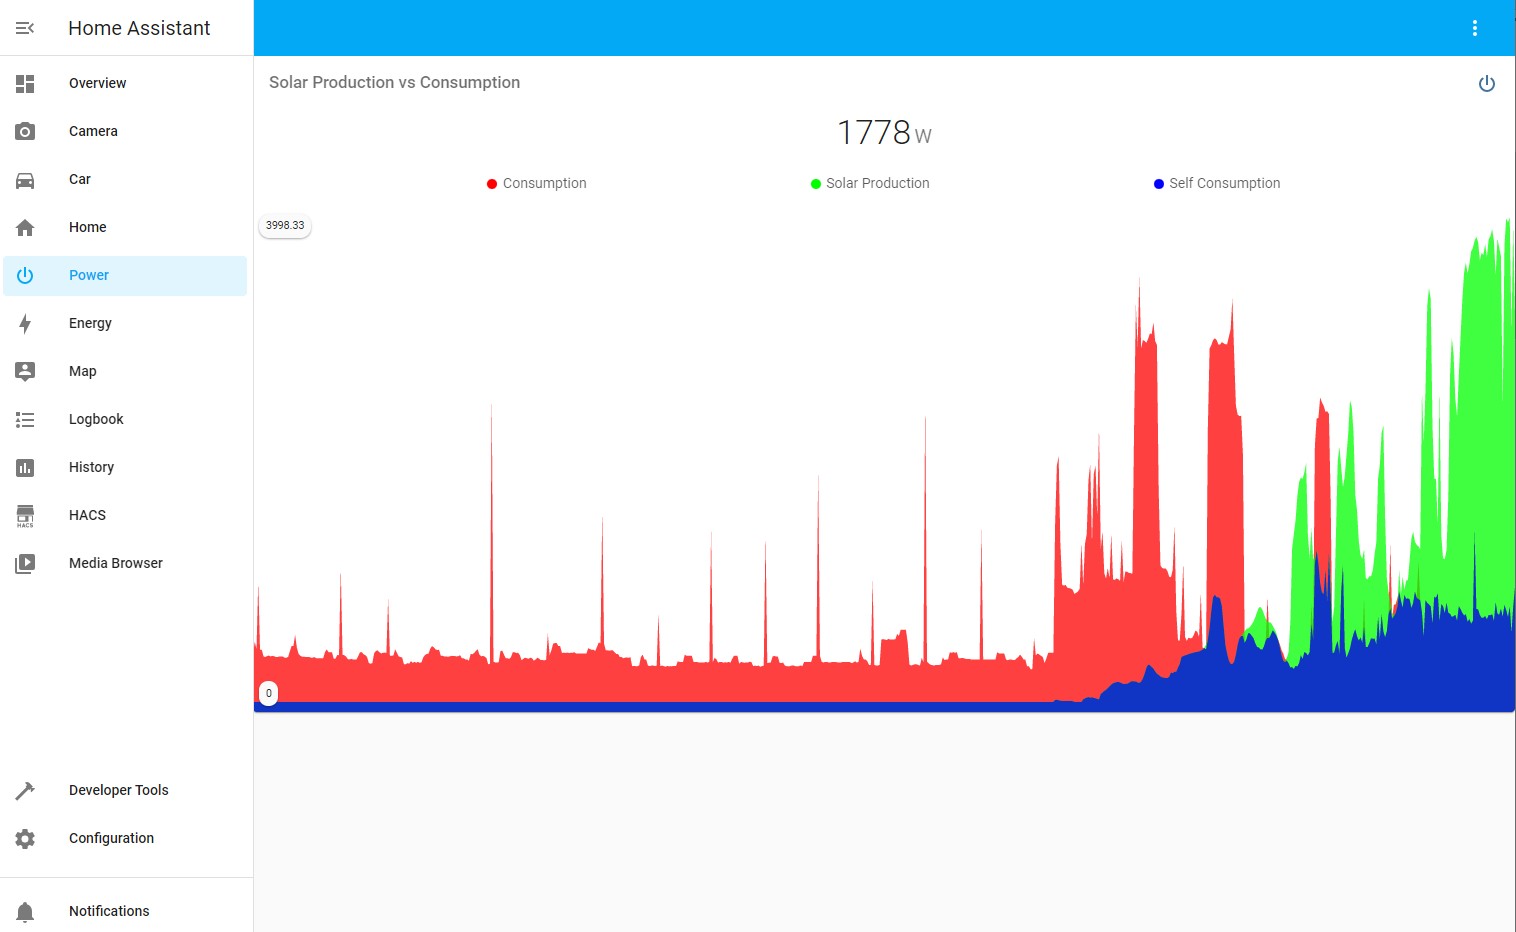
Graph now looks exactly how I wanted it…
Thanks!
2 Likes
Great, this is really nice styling))
2 Likes
baz123
November 16, 2021, 7:59am
1919
Can you set the name: of an entity to the state (string) of another entity by using a template?
name: {{states('sensor.weight_string')}}
Works in the Template editor but not as a name in the card
No, templates may be applied only if the card is placed inside config-template-card
1 Like
Luth1ng
November 16, 2021, 11:16pm
1921
Hi!multiple show_state · Issue #56 · kalkih/mini-graph-card · GitHub
With 2 entities with “show_state: true” it works fine, but with 3 entities, no…
Here’s my config :
type: custom:mini-graph-card
name: Temp
entities:
  - entity: sensor.theeye_air_temperature
    name: Terrasse
    color: green
    show_state: true
  - entity: sensor.ble_temperature_thermometre1
    name: Bureau
    color: skyblue
    show_fill: false
    show_state: true
  - entity: sensor.laporte_air_temperature
    name: Salon
    color: red
    show_fill: false
    show_state: true
  - entity: binary_sensor.night
    color: rgba(255,255,255,.25)
    y_axis: secondary
    aggregate_func: min
    show_state: false
    show_line: false
    show_points: false
    show_name: false
    show_icon: false
    name: Nuit
state_map:
  - value: 'off'
    label: Jour
  - value: 'on'
    label: Nuit
show:
  icon: false
  fill: fade
line_width: 3
hours_to_show: 168
animate: true
decimals: 1
hour24: true
align_state: center
align_header: center
Could I achieve this ? How ?
boxi
November 19, 2021, 6:55pm
1922
Hi can you share your code pls ?
EdwinNL
December 5, 2021, 1:33pm
1923
Did this ever get a follow-up?
Any idea why my mini graph cards aren’t being displayed on my nest hub when casting my dashboard from duckdns?
Happens on both my nest hub and nest hub max.
Could be due to CATT, or the nest hub itself, but it was fine when I was casting a local http dashboard (as opposed to https dns).
[Update: Must be an issue with duckdns/https and mini graph card.
did67
December 9, 2021, 4:42pm
1925
It’s possible to convert an ppm ?
sidlauskas
December 12, 2021, 6:43pm
1926
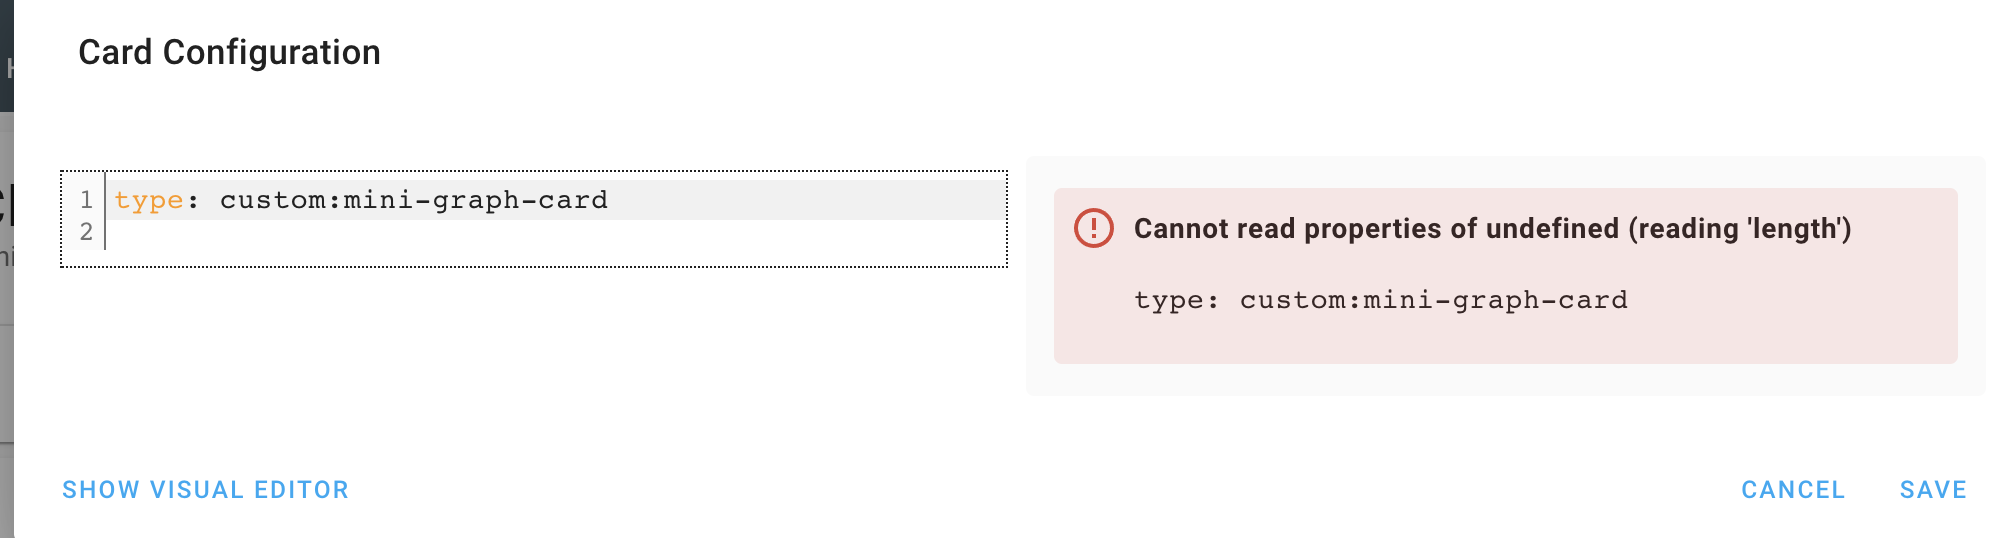
Successfully added, but it’s not working. HA core-2021.11.5. Can someone tell me what I’m doing wrong here?
You should specify at least one entity
sidlauskas
December 12, 2021, 9:11pm
1928
It only works when I specify it this way:
cards:
  - entities:
      - entity: water_heater.vicare_water
        name: Water temperature
    type: custom:mini-graph-card
type: horizontal-stack
This code is minimal to work:
  - type: custom:mini-graph-card
    entities:
      - entity: water_heater.vicare_water
sidlauskas
December 12, 2021, 9:33pm
1930
nope, it doesn’t work this way either
This is a code to be used in yaml mode:
view: ...
...
cards:

  - type: custom:mini-graph-card
    entities:
      - entity: water_heater.vicare_water
This is a code to be used in storage mode - i.e.creating cards from UI:
type: custom:mini-graph-card
entities:
  - entity: water_heater.vicare_water
A view = a list of cards.
- abc
  jkkkkjkj
  yyyyyyyyyy
- def
  jjuuy
- 123abc
pepe59
December 12, 2021, 11:42pm
1932
If you are using user interfaces, remove the hyphen at type.
type: custom:mini-graph-card
entities:
  - entity: sensor.living_room_temperature
SteveA
December 20, 2021, 5:02pm
1933
It is possible to show_state for multiple entities in a single row as opposed to stacked across the right side? I am tracking 5 Temperature sensors and showing the legend it would be cleaner to show the legend and the current state together. Thanks