Possible with using hacks only.
May give unstable results since card’s width is hardcoded.
And no legend is shown.

Thank you. Perhaps a future enhancement for the show_legend option?
Initial idea of @kalkih (see here), added some flexibility.

type: custom:mini-graph-card
entities:
  - entity: sensor.speedtest_local_download
  - entity: sensor.speedtest_local_upload
    y_axis: secondary
    show_state: true
show:
  labels: true
  labels_secondary: true
height: 300
hours_to_show: 24
line_width: 2
points_per_hour: 60
lower_bound_secondary: 0
lower_bound: 0
card_mod:
  style: |
    .line--rect,
    .fill--rect,
    .line--points {
      transform: scaleY(50%);
    }
    .line--rect:last-of-type,
    .fill--rect:nth-of-type(2),
    .line--points:last-of-type {
      transform-origin: center center;
      transform: rotateX(180deg) scaleY(50%) translateY(-150px);
    }
    .graph__labels.--secondary {
      flex-direction: column-reverse;
    }
    .graph__container__svg {
      margin-bottom: 20px
    }
Also, it is possible to to add a divider line as an X-axis:

type: custom:mini-graph-card
entities:
  - entity: sensor.speedtest_local_download
  - entity: sensor.speedtest_local_upload
    y_axis: secondary
    show_state: true
height: 200
show:
  labels: true
  labels_secondary: true
  fill: fade
card_mod:
  style: |
    .line--rect,
    .fill--rect,
    .line--points {
      transform: scaleY(50%);
    }
    rect.fill--rect:nth-of-type(1) {
      outline: 1px solid var(--secondary-text-color);
    }
    rect.fill--rect:nth-of-type(2),
    rect.line--rect:last-of-type,
    .line--points:last-of-type {
      transform-origin: center center;
      transform: rotateX(180deg) scaleY(50%) translateY(-100px);
    }
    .graph__labels.--secondary {
      flex-direction: column-reverse;
    }
    .graph__container__svg {
      margin-bottom: 16px;
    }
5 Likes
How can I set a title instead of a name?
Like this:

instead of this:

I tried setting a title parameter with show name to false, but it did,t work
You may set only parameters described in docs.
This simple code:
type: custom:mini-graph-card
entities:
  - entity: sensor.cleargrass_1_co2
    name: co2
hours_to_show: 24
name: My title
shows a whole graph name:

But if some point is touched by a mouse then that “graph name” is replaced by an “entity name”:

1 Like
I’m charting power usage of a plug which is either consuming ~600W or ~90W, there is no in-between

But in mini-graph-chart it appears as is the power was 257W for a while, even when smoothing is disabled
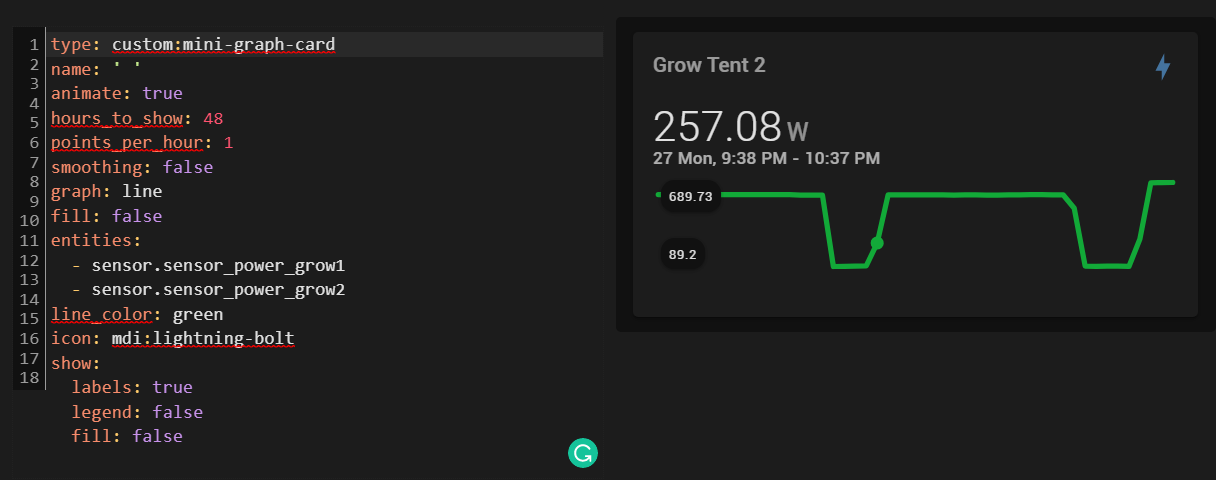

“aggregate_func: max” makes it a little better but still the same problem. Is there anything else I can do? I tried others aggregate parameters too
Try aggregate_func: last and more points_per_hour
1 Like
Thank you I got it fixed but I am wondering why the min/max values are not showing up when enabling extrema?
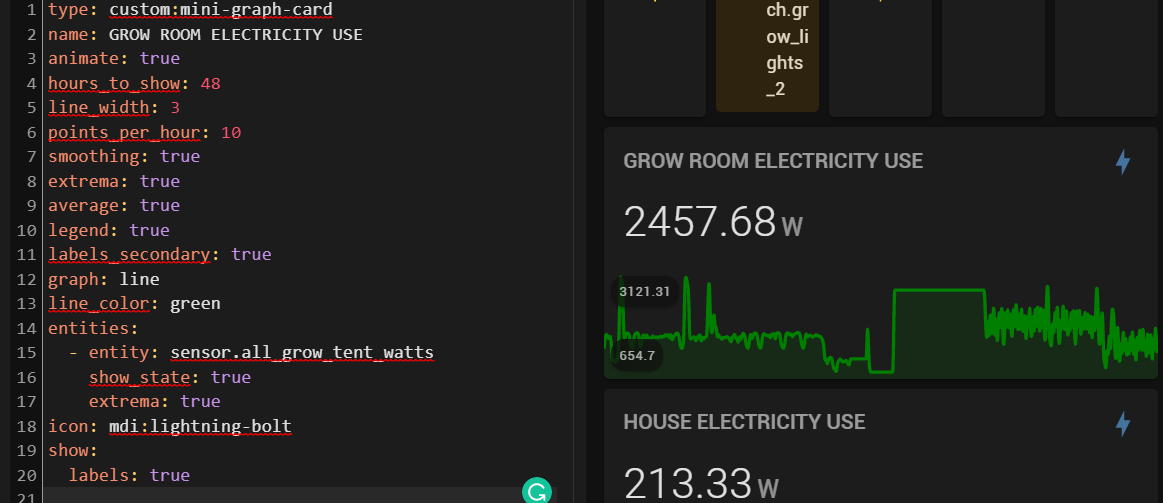
You have not enabled extrema - check the doc. As well as legend. The code contains misplaced options.
Which doc are you referring to? I’ve read many times this one: https://github.com/kalkih/mini-graph-card
But CTRL+F on “Extrema” returns only 1 result:
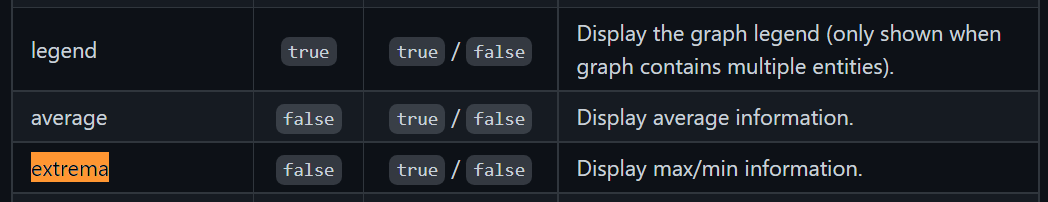
And I’m not sure what I have to do with the legend either

How to set a color for the last bar:
  - type: custom:mini-graph-card
    entities:
      - entity: sensor.cleargrass_1_co2
    show:
      graph: bar
    card_mod:
      style: |
        rect.bar:last-of-type {
           fill: red;
        }

(as an answer for this issue)
Hello, I was trying to make a stock graph where the color is red when the market is under the previous close value, but I not able to have variable in my code I don’t understand why. I already tried everything I could find here but it still doesn’t work.
type: custom:mini-graph-card
variables:
  - current_val: states['sensor.yahoofinance_cspx_as'].state
  - previous_market_close: stat_attr('sensor.yahoofinance_cspx_as', 'regularMarketPreviousClose')
entities:
  - sensor.yahoofinance_cspx_as
hours_to_show: 25
points_per_hour: 4
color_thresholds:
  - value: '${previous_market_close}'
    color: '#8AFF8A'
  - value: '${previous_market_close}'
    color: '#c0392b'
show:
  labels: true
  points: false
  y_axis: true
  show_line: true
  icon_adaptive_color: true
  extrema: true
Where in the mini graph card docs did you see this support for variables?
1 Like
You’ll have to use config-template-card in combination with the mini-graph for what you want to achieve.
1 Like
#1. Is there no option for making an X-axis in the graph? I want to have all 24h hours of the day to be displayed?
#2. Also, is there no way to be able to see all 24h in static mode. But with the current time to be marked somehow. I want to use Nordpools electricity prices forecast for the whole day to be displayed.
Now I can only see current time and 24hours history.
Is there a way to show only current day, e.g from 00.00 to 00.00 and no history from yesterday?
You could try apexcharts-card with this
type: custom:apexcharts-card
experimental:
  color_threshold: true
graph_span: 1d
header:
  title: Elpriser idag
  show: true
span:
  start: day
now:
  show: true
  label: Nu
series:
  - entity: sensor.nordpool_kwh_se3_sek_3_10_025
    data_generator: |
      return entity.attributes.raw_today.map((entry) => {
        return [new Date(entry.start), entry.value];
      });
    color_threshold:
      - value: 0
        color: green
        opacity: 1
      - value: 1
        color: yellow
      - value: 1.5
        color: red
    type: column