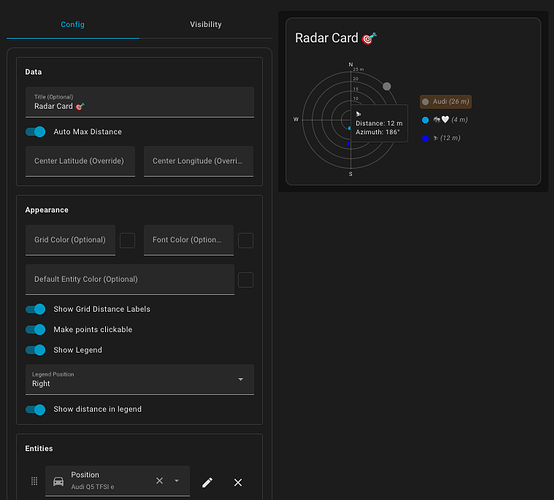
A Lovelace custom card to plot device_tracker entities on a radar chart
TL;DR: Visualize your devices on a radar-style chart in Lovelace, with auto-scaling, legends, and lots of customization.
 What is it?
The Radar Card lets you plot multiple device_tracker entities on a polar chart, with flexible configuration and a clean, interactive design.
 Features
Flexible plotting
- Display multiple device_tracker entities.
- Use HA location as center, or custom lat/long.
Dynamic radar display
- Auto-scale or fixed max distance.
- Optional grid distance labels.
Interactivity
- Hover for distance & azimuth.
- Click to open entity more-info (toggleable).
- Legend with clickable highlights.
Customization
- Grid, font, and entity colors.
- Per-entity name & color overrides.
- Legend position: bottom, left, right.
 Installation
Available in HACS (recommended).
Or install manually:
- Download radar-card.js from the latest release.
- Place it in /config/www.
- Add it under Settings → Dashboards → Resources :
- URL: /local/radar-card.js
- Type: JavaScript Module
 Example Configuration
type: custom:radar-card
title: Device Locations
entity_color: 'var(--accent-color)'
entities:
  - entity: device_tracker.person1
    name: Person 1
    color: '#ff0000'
  - device_tracker.person2
  - entity: device_tracker.car
    color: 'blue'
 Development / Feedback
Repo: timmaurice/lovelace-radar-card
I’d love to hear your feedback, ideas, or bug reports. If you try it out, let me know how it works for you!

