Lovelace Raspberry Pi Status Card

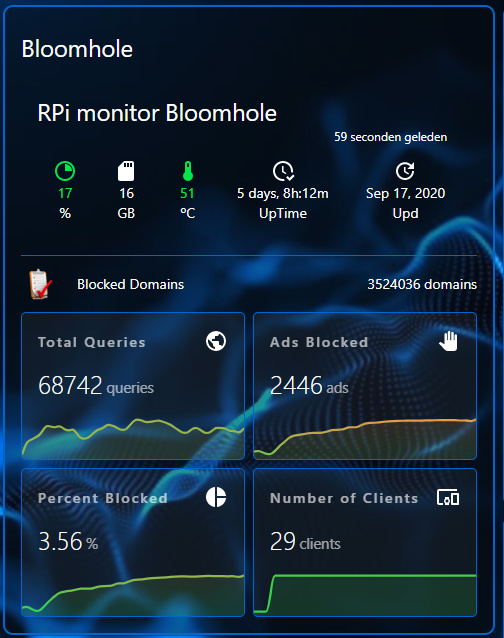
Use one of these Lovelace cards for displaying the status of each of your networked Raspberry Pis on Home Assistant.

Install the sensor script on each RPi to be monitored and display each RPi using one of these cards. Using these cards make up your own dashboard for monitoring all of your Raspberry Pis in one place.

GitHub: The card: Lovelace RPi Monitor Card shows the status of a Raspberry Pi.

GitHub: The Script RPi Reporter MQTT2HA Daemon gathers specifics about your RPi and sends these to your HA installation.

12 Likes

Thank you for your work on this. I have 4 pi’s that I want to monitor. I followed the instructions on the Daemon github page and everything went great and is working fine for 3 of the 4 Pi’s. The remaining Pi is the one that is running home-assistant itself. I’m a newbie to home-assistant and I can’t find a way to get to the linux command-line on the home-assistant pi. When I ssh to the pi as root (with a key) I get the home-assistant cli from which I can’t run any of the installation commands. Am i missing something? Is it possible to install the daemon to report data from this Pi?

I see that you can create platform sensors in home assistant to get some of this data such as:

 - platform: systemmonitor
    resources:
      - type: last_boot

or

  - platform: command_line
    name: CPU Temp
    command: "cat /sys/class/thermal/thermal_zone0/temp"
    unit_of_measurement: "°C"
    value_template: '{{ value | multiply(0.001) | round(2)  }}'

But it would be nice to get the same data from mqtt and use your monitor card to match the others.

Any clarification on if this is possible and how to proceed would be appreciated.

Hi, I’m glad to hear installation has worked on the other three. The RPi running home assistant is a diff. challenge. I don’t run mine that way… but give me a couple of days and i’ll try to figure it out and get back to you. Maybe someone else on this forum can help in the mean time?

All, FYI

I found a problem with the MQTT Daemon for this card. Log Rotate was interfering with how the script was detecting the last update date. A new version of the script has been released. Please update your RPi’s to the latest script!

Added new config settings too (fallback_domain & discovery_prefix)
Also added new support for installation as SysV init script which works on older Raspian Jessie installations, see the repo README.md for details.

Awesome project! Love it!
Installation worked like a charm. Very much appreciate the detail manual and guide :ok_hand:

2 Likes

I think to run it on the HA RPi, it is going to have to run as an add-on. I’ve played around with that a bit, but it’s problematic…

  1. I believe it would have to run as a privileged add-on with increased access. This can be done, but it throws all sorts of warnings in the UI.
  2. The latest update to the script adds “noqueue” to the interface check. This won’t work in docker as all the interfaces show up with that parameter set. And if the script throws an exception if the interface list is empty.
  3. The tool depends on /opt/vc/bin/vcgencmd which doesn’t exist in the image or the image repos. W/o it the script crashes and doesn’t send an MQTT message.

I have something that will build and run at https://github.com/sjthespian/addon-rpi-reporter. Note that this is not working due to #3 above (there’s a workaround for #2 in the Dockerfile).

FYI- the logic using noqueue is to eliminate all the interfaces generated by this form of install (bridge, veth*, hassio and docker* interfaces. The script simply wants to find only wlan0 and eth0 (or whatever names they are for the RPi actual hardware interfaces.) That part of the script should never return with an empty unless the hardware interfaces are not present.

It would be very helpful for you to run the ip(8) command on your device ip link show and see if the hardware interfaces are there on your device. if they are there why did they have noqueue set on them? Would you have time to provide this info?

I do run this script on my HA RPi 3+ I installed using Home Assistant Supervised form. It has been running without issue since i developed this script feeding the info to the the monitor card.

(I’m one of those users that requires remote shell access for all of my network devices so using a prebuilt RPi image was never going to work for me. For years all of my devices have been reporting their status/health sensor data to a central network machine/repository. Developing the reporting mech for HA has only happened since I started working with a number of friends who convinced me to start my own home HA setup. :wink: )

FYI- if you have Onion omega2+'s on your network you can now monitor them too! See my new project https://github.com/ironsheep/Omega2-Reporter-MQTT2HA-Daemon

Christopher,
I installed my HA on my RPi differently which allowed me to run this and other scripts on the same RPi as HA. I installed using Home Assistant Supervised form.
-Stephen

Thanks Stephen. I am in the process of installing home assistant supervised on another pi.

Unfortunately when this runs as an add-on it is running in docker, and all of the interfaces have noqueue set.

  /config git:(master) âś— docker run -ti --entrypoint=/bin/ash local/armv7-addon-rpireporter:0.1
root@7d87e12a140e:/$ /sbin/ip link show
1: lo: <LOOPBACK,UP,LOWER_UP> mtu 65536 qdisc noqueue state UNKNOWN qlen 1000
    link/loopback 00:00:00:00:00:00 brd 00:00:00:00:00:00
114: eth0@if115: <BROADCAST,MULTICAST,UP,LOWER_UP,M-DOWN> mtu 1500 qdisc noqueue state UP
    link/ether 02:42:ac:11:00:03 brd ff:ff:ff:ff:ff:ff

I think I should be able to make this work as an add-on, as I can work around this with a simple sed in the docker file. The bigger showstopper at the moment is vcgencmd, since that doesn’t exist in the docker image and it doesn’t look like it is possible to install it.

Can anyone tell me if there is a way to not display the name of the card?
I use the card inside a vertical-stack, and I dont want to have the name displayed multiple times like this:
image

You would think if you just use name: “”, it would remove it, and it does, but then this happens and its all scrambled up:
image

If you add a space in the name like name: " " this happens, which is better, but still scrambled up.
image

I have tried looking in the rpi-monitor-card.js file, but whatever change I make in there, doens’t have any effect at all. Even after rebooting.

Any have an idea as to how I can get this to work the way I want?

@duncan86 well, not sure I’ve seen that happen. Maybe I didn’t notice it because of what I use?

Here’s my typical config:

  - type: 'custom:rpi-monitor-card'
    entity: sensor.rpi_monitor_pinode4
    card_style: glance
    temp_scale: F
    name_prefix: 'RPi -'

Which looks like this:
Screen Shot 2020-09-16 at 14.00.02

@IronSheep I think that might be the case. I use it inside of a vertical-stack. This is my complete card config:

- entities:
      - card_style: glance
        entity: sensor.rpi_monitor_bloomhole
        fs_severity:
          - color: '#00e64d'
            from: 0
            to: 60
          - color: '#ff944d'
            from: 61
            to: 85
          - color: '#ff4d4d'
            from: 86
            to: 100
        style: |
          ha-card {
            border-radius: 5px;
            background-image: none;
            box-shadow: none;
            background-color: rgba(114, 123, 140, 0);
           }
        temp_scale: C
        temp_severity:
          - color: '#00e64d'
            from: 0
            to: 60
          - color: '#ff944d'
            from: 61
            to: 80
          - color: '#ff4d4d'
            from: 81
            to: 100
        type: 'custom:rpi-monitor-card'
      - type: divider
      - entity: sensor.bloomhole_domains_blocked
        name: Blocked Domains
      - card_type: horizontal-stack
        cards:
          - align_state: left
            color_thresholds:
              - color: '#00e64d'
                value: 50000
              - color: '#ff944d'
                value: 80000
              - color: '#ff4d4d'
                value: 150000
            entities:
              - entity: sensor.bloomhole_dns_queries_today
                index: 0
            font_size: 75
            font_size_header: 12
            height: 100
            hour24: true
            icon: 'mdi:earth'
            name: Total Queries
            points_per_hour: 2
            show:
              labels: false
              name: true
            style: |
              ha-card {
                border-radius: 5px;
                background-image: none;
                box-shadow: none;
                background-color: rgba(114, 123, 140, 0.1);
                font-weight: bold;
                border: solid 1px var(--primary-color);
               }
            type: 'custom:mini-graph-card'
          - align_state: left
            color_thresholds:
              - color: '#00e64d'
                value: 1
              - color: '#ff944d'
                value: 2500
              - color: '#ff4d4d'
                value: 10000
            entities:
              - entity: sensor.bloomhole_ads_blocked_today
                index: 0
            font_size: 75
            font_size_header: 12
            height: 100
            hour24: true
            icon: 'mdi:hand-right'
            more_info: false
            name: Ads Blocked
            points_per_hour: 2
            show:
              labels: false
              name: true
            style: |
              ha-card {
                border-radius: 5px;
                background-image: none;
                box-shadow: none;
                background-color: rgba(114, 123, 140, 0.1);
                font-weight: bold;
                border: solid 1px var(--primary-color);
               }          
            type: 'custom:mini-graph-card'
        type: 'custom:hui-element'
      - card_type: horizontal-stack
        cards:
          - align_state: left
            color_thresholds:
              - color: '#00e64d'
                value: 1
              - color: '#ff944d'
                value: 5
              - color: '#ff4d4d'
                value: 15
            entities:
              - entity: sensor.bloomhole_ads_percentage_blocked_today
                index: 0
            font_size: 75
            font_size_header: 12
            height: 100
            hour24: true
            icon: 'mdi:chart-pie'
            name: Percent Blocked
            points_per_hour: 2
            show:
              labels: false
              name: true
            style: |
              ha-card {
                border-radius: 5px;
                background-image: none;
                box-shadow: none;
                background-color: rgba(114, 123, 140, 0.1);
                font-weight: bold;
                border: solid 1px var(--primary-color);                
               }          
            type: 'custom:mini-graph-card'
          - align_state: left
            color_thresholds:
              - color: '#00e64d'
                value: 25
              - color: '#ff944d'
                value: 40
              - color: '#ff4d4d'
                value: 55
            entities:
              - entity: sensor.bloomhole_seen_clients
                index: 0
            font_size: 75
            font_size_header: 12
            height: 100
            hour24: true
            icon: 'mdi:devices'
            more_info: false
            name: Number of Clients
            points_per_hour: 2
            show:
              labels: false
              name: true
            style: |
              ha-card {
                border-radius: 5px;
                background-image: none;
                box-shadow: none;
                background-color: rgba(114, 123, 140, 0.1);
                font-weight: bold;
                border: solid 1px var(--primary-color);
               }          
            type: 'custom:mini-graph-card'
        type: 'custom:hui-element'
    style: |
      ha-card {
         border: solid 2px var(--primary-color);
        }
    title: Bloomhole
    type: entities

Which looks like this:

So might there be a way to completely remove the title from the card? If I remove the title from the vertical stack so I can use the title from the Lovelace-Raspberry-Pi-Status-Card, the titles from my cards don’t line up (and I can’t stand that :laughing:)
So I really hope there is a way to remove the title from the RPi card without getting things scrambled.

Hi @duncan86 I’ve posted a new issue for you so you can track the progress. Should take a couple of days or so https://github.com/ironsheep/lovelace-rpi-monitor-card/issues/8

Hi @IronSheep great! Thanks! I’ll keep track of it.

I’ve been trying to get this card working for a few days now, and need some help.

What I’ve done so far:

  1. installed the card via HACS
  2. installed the [Omega2-Reporter-MQTT2HA-Daemon ] and verified it’s working on my rpi
  3. modified ui-lovelace.yaml with link to card
  4. in HA, try to add a custom card and paste your example, gives me the error:

Is this the wrong place to add the card?

I found the hidden dashboard resources button and added the *.js file there. Also, changed to hostname to IP Address. Now the card isn’t erroring, the sensor is.

I was able to test this MQTT from Windows to RPi and was able to get the message, so it’s working.

Is there something else I need to install to get the sensor working?

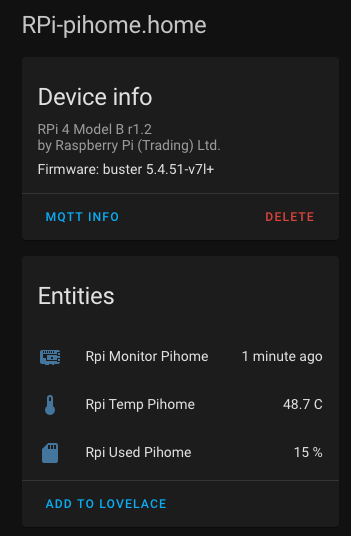
Hi, do you have MQTT autodiscovery turned on? If you do you should be able to visit Configuration -> Devices and then locate the discovered RPi. If you click on that card you should be told what the Entity name (sensor name) is. This card also shows if the sensor is receiving any data via MQTT, if the RPi is running it should be. Here’s one of mine as discovered:

Tap on add to lovelace to get a suggestion for how to add it:

You’ll only need the sensor-rpi-monitor.* line. Here’s an excerpt from one of my lovelace view-*.yaml files:

title: My RPi's
icon: 'mdi:raspberry-pi'
path: rpi-dashboard
panel: false
badges: []
cards:
  - type: 'custom:rpi-monitor-card'
    entity: sensor.rpi_monitor_pihome
    card_style: glance
    temp_scale: F
    name_prefix: 'RPi -'
    

This help?

Help? no, it was the answer I was looking for. Somehow I must have missed this in the instructions, but as soon as I configured MQTT in the configuration.yaml, everything worked!

Thank you so much!

why are you guys using mqtt? its should a simple card…