Hi @duncan86 I’ve posted a new issue for you so you can track the progress. Should take a couple of days or so https://github.com/ironsheep/lovelace-rpi-monitor-card/issues/8
I’ve been trying to get this card working for a few days now, and need some help.
What I’ve done so far:
- installed the card via HACS
- installed the [Omega2-Reporter-MQTT2HA-Daemon ] and verified it’s working on my rpi
- modified ui-lovelace.yaml with link to card
- in HA, try to add a custom card and paste your example, gives me the error:

Is this the wrong place to add the card?
I found the hidden dashboard resources button and added the *.js file there. Also, changed to hostname to IP Address. Now the card isn’t erroring, the sensor is.

I was able to test this MQTT from Windows to RPi and was able to get the message, so it’s working.

Is there something else I need to install to get the sensor working?
Hi, do you have MQTT autodiscovery turned on? If you do you should be able to visit Configuration -> Devices and then locate the discovered RPi. If you click on that card you should be told what the Entity name (sensor name) is. This card also shows if the sensor is receiving any data via MQTT, if the RPi is running it should be. Here’s one of mine as discovered:
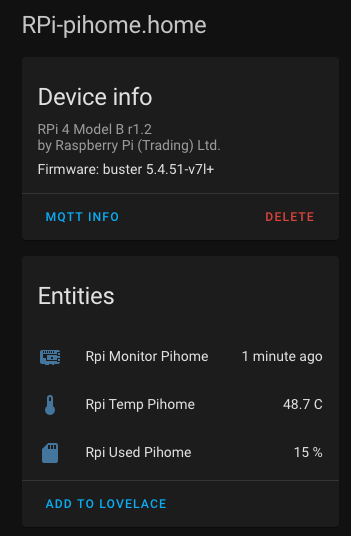
Tap on add to lovelace to get a suggestion for how to add it:

You’ll only need the sensor-rpi-monitor.* line. Here’s an excerpt from one of my lovelace view-*.yaml files:
title: My RPi's
icon: 'mdi:raspberry-pi'
path: rpi-dashboard
panel: false
badges: []
cards:
  - type: 'custom:rpi-monitor-card'
    entity: sensor.rpi_monitor_pihome
    card_style: glance
    temp_scale: F
    name_prefix: 'RPi -'
This help?
Help? no, it was the answer I was looking for. Somehow I must have missed this in the instructions, but as soon as I configured MQTT in the configuration.yaml, everything worked!
Thank you so much!
why are you guys using mqtt? its should a simple card…
@KingRichard I think you may be missing one use model. If you have a small farm of RPi’s & Onion Omega2+'s not just one running HA then you might like having MQTT as the receiver/forwarder for all of them. Then you have a dashboard showing all of them at a glance. For Example:

well in my case hacs come in handy… by using home-assistant-remote which work very nice…But I do agree when you have tons of RPI running. In my case my main Host is synology and have 1 extra RPI for connecting some of my BT devices
I got this working, but noticed some errors in my yaml saying there are 2 sensor: entries. It’s true one for Aarlo and one for MQTT. How do I keep both of these, partition the yaml into multiple files?
How can I get the used memory to display it in a graph?
I only get the string from mqtt, but need just the value from free_mb.
memory
free_mb: '3090.520'
size_mb: '3827.941'
Hello together
I’m doing something wrong with the “RPi-Reporter-MQTT2HA-Daemon” and hours of searching didn’t get me any further.
I (finally) receive data in HA. E.g. displayed with a debugger in Node-Red.
...{"info": {"timestamp": "2020-11-23T12:46:45+00:00", "rpi_model": "RPi 4 Model B r1.1", "ifaces": "e,w,b", "host_name": "Unifi-Controller", "fqdn": "Unifi-Controller.unifi-controller", "ux_release": "buster" .....
I have connected the Lovelace Card, but I do not receive any data. I noticed that probably the hostname is not correctly taken over. The debugger always shows "home/nodes/sensor/rpi-{hostname}/monitor ". Without the hostname.
does anyone have an idea?
Thanks in advance
Have you looked at Configuration -> Devices and then tried to locate the discovered RPi? once you find it you can use the sensor name in your lovelace config to attach to the sensor.
Hi @IronSheep
Thanks for replay. I can’t see any Devices in the Device view.
I have installed the Daemon on an other Pi. Just to make sure, I did all as mention in your README.md.
The Daemon connects zu Mosquitto broker on my HA.
1606684326: New connection from 192.168.1.32 on port 1883.
1606684326: New client connected from 192.168.1.32 as auto-666B58A2-2A1F-3EDB-CF25-E082D1C2FE8C (p2, c1, k60).
the log shows the following:
2020-11-29 22:28:52 DEBUG (MainThread) [homeassistant.components.mqtt] Received message on homeassistant/sensor/rpi-{hostname}/monitor/config: b'{"name": "Rpi Monitor Node-Red-Prod", "uniq_id": "RPi-dca632Mon3102aa_monitor", "dev_cla": "timestamp", "stat_t": "~/monitor", "val_tpl": "{{ value_json.info.timestamp }}", "~": "home/nodes/sensor/rpi-{hostname}", "pl_avail": "online", "pl_not_avail": "offline", "ic": "mdi:raspberry-pi", "avty_t": "~/status", "json_attr_t": "~/monitor", "json_attr_tpl": "{{ value_json.info | tojson }}", "dev": {"identifiers": ["RPi-dca632Mon3102aa"], "manufacturer": "Raspberry Pi (Trading) Ltd.", "name": "RPi-Node-RED-Prod", "model": "RPi 4 Model B r1.1", "sw_version": "buster 5.4.72-v7l+"}}'

2020-11-29 22:28:52 DEBUG (MainThread) [homeassistant.components.mqtt] Received message on homeassistant/sensor/rpi-{hostname}/temperature/config: b'{"name": "Rpi Temp Node-Red-Prod", "uniq_id": "RPi-dca632Mon3102aa_temperature", "dev_cla": "temperature", "unit_of_measurement": "C", "stat_t": "~/monitor", "val_tpl": "{{ value_json.info.temperature_c }}", "~": "home/nodes/sensor/rpi-{hostname}", "pl_avail": "online", "pl_not_avail": "offline", "ic": "mdi:thermometer", "avty_t": "~/status", "dev": {"identifiers": ["RPi-dca632Mon3102aa"]}}'

2020-11-29 22:28:52 DEBUG (MainThread) [homeassistant.components.mqtt] Received message on homeassistant/sensor/rpi-{hostname}/disk_used/config: b'{"name": "Rpi Used Node-Red-Prod", "uniq_id": "RPi-dca632Mon3102aa_disk_used", "unit_of_measurement": "%", "stat_t": "~/monitor", "val_tpl": "{{ value_json.info.fs_free_prcnt }}", "~": "home/nodes/sensor/rpi-{hostname}", "pl_avail": "online", "pl_not_avail": "offline", "ic": "mdi:sd", "avty_t": "~/status", "dev": {"identifiers": ["RPi-dca632Mon3102aa"]}}'
I added the following lines to the configuration.yaml file
# MQTT Raspberry Pi Daemon (https://github.com/ironsheep/RPi-Reporter-MQTT2HA-Daemon)
sensor mqtt:
  - platform: mqtt
    name: "MQTT Monitor Node-Red-Prod"
    state_topic: "homeassistant/sensor/rpi-Node-Red-Prod/monitor/"
nothing, no additional device nor Entities…
sorry, I am standing in front of a mountain
kind - Roger
Ok, lets try another approach… please make sure your MQTT auto discovery is enabled. Then see how things look.
Here’s info https://www.home-assistant.io/docs/mqtt/discovery/
I understand that, according to the documentation, discovery is enabled by default. Nevertheless I still have added
mqtt:
  discovery: true
to the configuration.yaml file
do i have to have raspberry pi os installed on the other rpis or doesn’t it matter on what system they run? on the rpis i want to monitor i have dietpi and yunohost running. will this work?
From memory, it needs Python 3.5 (or higher) to get the mqtt client library which means it will not run on some cutdown or very old operating systems.
1 Like
i added the lovelace card and the script on the pi as told in the documentation. the pi is a pi2 with dietpi running on it.
systemctl status isp-rpi-reporter.service
● isp-rpi-reporter.service - RPi Reporter MQTT Client/Daemon
   Loaded: loaded (/opt/RPi-Reporter-MQTT2HA-Daemon/isp-rpi-reporter.service; enabled; v
endor preset: enabled)
   Active: active (running) since Sat 2020-12-19 07:47:05 GMT; 11s ago
     Docs: https://github.com/ironsheep/RPi-Reporter-MQTT2HA-Daemon
 Main PID: 10184 (python3)
   Status: "Dec 19 07:47:04 - * MQTT connection established."
    Tasks: 4 (limit: 2182)
   CGroup: /system.slice/isp-rpi-reporter.service
           └─10184 /usr/bin/python3 -u /opt/RPi-Reporter-MQTT2HA-Daemon/ISP-RPi-mqtt-dae
mon.py
everything - i think - worked fine so far, but i can’t find the pi in the devices list. autodedection of mqtt is turned. when i check the mqtt-logs i see that there is an error, but i don 't understand what it means (…69 is my pi):
1608363880: New connection from 192.168.178.69 on port 1883.
[INFO] found mqtt on Home Assistant
1608363881: New client connected from 192.168.178.69 as auto-C70DB27C-F4E8-3598-A2E6-23FB2C6BC092 (p2, c1, k60, u'mqtt').
1608363987: Socket error on client auto-C70DB27C-F4E8-3598-A2E6-23FB2C6BC092, disconnecting.
1608364024: New connection from 192.168.178.69 on port 1883.
1608364024: New client connected from 192.168.178.69 as auto-CB115497-5351-31AF-B93B-FCEAA8194D04 (p2, c1, k60, u'mqtt').
1608364681: Saving in-memory database to /data/mosquitto.db.
1608364725: Socket error on client 3B7e70iy4l0Uuy46BoioEM, disconnecting.
maybe this has to do with another issue. when testing the script on the pi, it connects to the mqtt and delivers the data but at the end does not go back to the command line. it just stops. command line is only shown when i press ctrl-c.
root@DietPi:~# python3 /opt/RPi-Reporter-MQTT2HA-Daemon/ISP-RPi-mqtt-daemon.py

[2020-12-19 07:09:02] * MQTT connection established
[2020-12-19 07:09:02]
[2020-12-19 07:09:03] Announcing RPi Monitoring device to MQTT broker for auto-d        iscovery ...
[2020-12-19 07:09:04] Publishing to MQTT topic "home/nodes/sensor/rpi-{hostname}        /monitor, Data:{"info": {"timestamp": "2020-12-19T07:09:03+00:00", "rpi_model":         "RPi 2 Model B r1.1", "ifaces": "e", "host_name": "DietPi", "fqdn": "DietPi.home        ", "ux_release": "buster", "ux_version": "5.4.72-v7+", "up_time": "18 days,   9:        39", "last_update": "2020-12-18T23:50:58+00:00", "fs_total_gb": 32, "fs_free_prc        nt": 10, "networking": {"eth0": {"IP": "192.168.178.69", "mac": "b8:27:eb:65:61:        63"}}, "drives": {"root": {"size_gb": 32, "used_prcnt": 10, "device": "/dev/root        ", "mount_pt": "/"}}, "memory": {"size_mb": "974.387", "free_mb": "808.012"}, "c        pu": {"hardware": "BCM2835", "model": "ARMv7 Processor rev 5 (v7l)", "number_cor        es": 4, "bogo_mips": "230.40", "serial": "00000000eb656163"}, "throttle": ["thro        ttled = 0x0", "Not throttled"], "temperature_c": 35.8, "temp_gpu_c": 35.8, "temp        _cpu_c": 35.8, "reporter": "ISP-RPi-mqtt-daemon v1.5.4", "report_interval": 5}}"
do you have any hints what my issue could be and how to fix it?
Look like it is working.
The default for the client side is that it keeps running and sends updates every 5 minutes … which is why it did not return to command line prompt.
So the challenge is to find it in HA.
Try looking under Configuration/Entities and filter for rpi