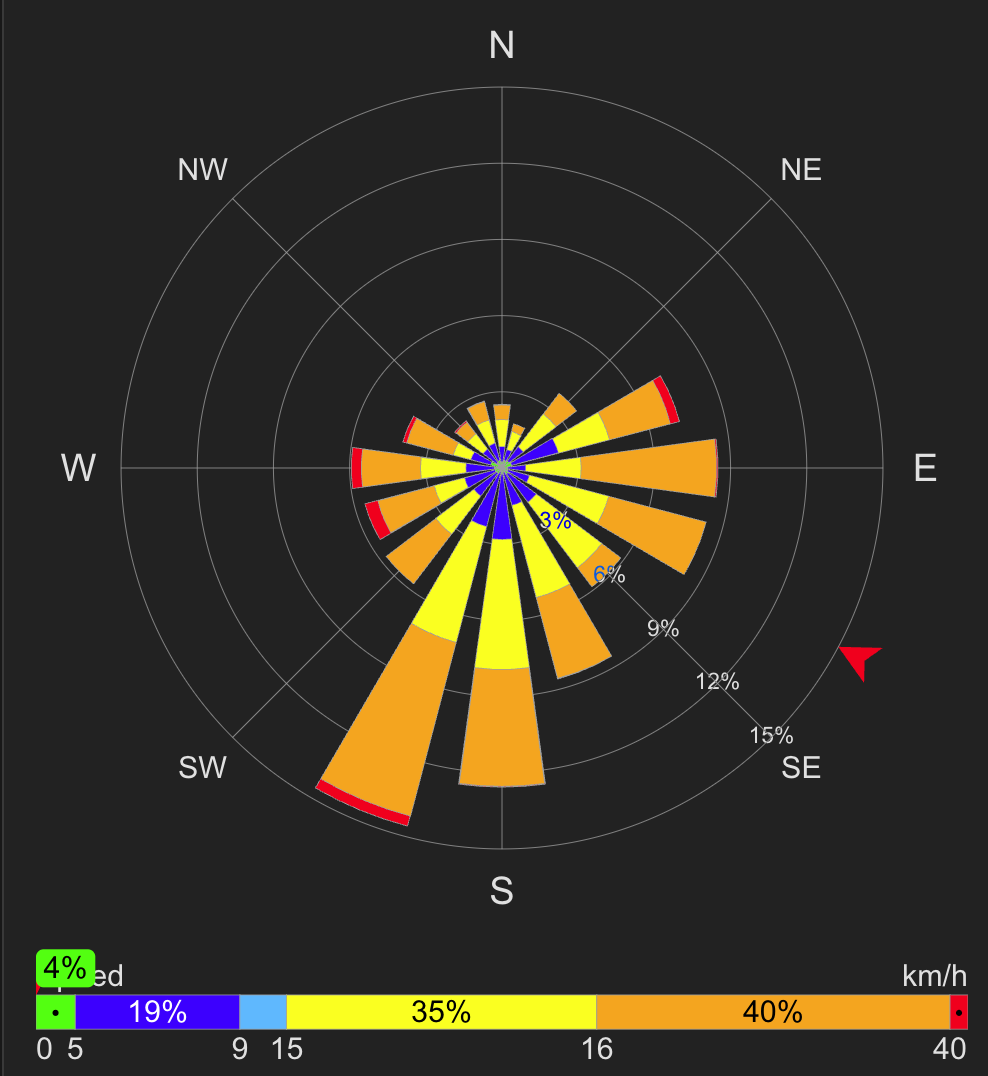
Finally the next big version is ready. I made it a major version bump, because there are breaking configuration changes.
The configuration error messages should guide you in fixing the cards configuration.
Four feature requests are implemented.
For me the coolest new feature, it’s possible to play an animation of the windrose over time.
There is a new example in the EXAMPLES.md which demonstrates this.
Bugs, please report them on GitHub.
The new features:
More options to configure a time period with a period code, exmaple: -200h (200 hours), -2w (2 weeks), -2m+1w (2 month, 1 week)
Button to toggle between the speed sensor used for the rose graph. Fixes #172.
Button to shift the time period hours back or forward in time.
Button to start an animation of windrose over time.
Rose legend circle percentages configurable, default auto.
Added use_for_windrose in windspeed_entities object. Can be changed with a button.
New data_period option: preset_period
Possible options: today, yesterday, last_7_days, last_30_days, this_week, last_week, this_month, last_month, last_6_months, this_year, last_year
The data_period properties can be used in the buttons config. With a button click you can change the period and statistics config of the data used. Fixes #174
New template vars: start_date, start_time, end_date, end_time
The exact start and end date time of the active period. Useful when using buttons to shift the time period.
Rename template vars: period-hours and period-minutes to match-period-hours and match-period-minutes.
New template vars: period-hours and period-minutes, now containing the whole period, not only that of the first and last matched measurement.
When there is no value available for an template variable, the placeholder is removed from the template.
Improved error handling, when no measurements are found.
Button border color can now be configured. Fixes #176
Default generated config uses more features.
All removed/moved/changed config options should show an error message with helpful info, to help with the upgrade.
Reminder, if you skipped version 2.0.0, ithas breaking changes. The error message should guide you to a correct configuration.
Features:
Added clip_background_image option in rose_config. Hide the background image part outside the outer circle. Fixes #184
Added option new_row for button, force the button to the next row. Fixes #178
Fixes:
Don’t allow data_period and active period_selector button at the same time… Before the active button was used for the period, the data_period was ignore.
Default config for new card still used the hours_to_show option. Fix the default generated config and made it use a more features.